Skip to content
 Intrinsic Value Assessment Of Euronav (EURN)
By Ladislao Zichy Thyssen From The Investor’s Podcast Network | 06 August 2020
INTRODUCTION
The crude oil shipping business seems to incinerate capital for pleasure, earning its reputation as a terrible business. However, its cyclical nature offers investors the opportunity to own a money printing press during certain periods in the cycle. We are at the dawn of one of these prosperous periods. Euronav (EURN) is a Belgian-based oil shipping company with a fleet of over 70 vessels. Its stock price is $9.80, even though in the last six months (Q4 & Q1), it has produced an EPS of $1.85 with another $1 expected for Q2 2020. Consequently, Euronav reduced its debt per share by over a dollar and paid $1.10 in dividends.
These strong earnings results are expected to continue over the next few years due to strong macro tailwinds. If the bull thesis proposed in the macro section plays out, one could expect their investment to potentially grow by 2x to 10x. However, it may be subject to substantial volatility as the stock price climbs. Fortunately, this company trades at roughly two thirds net asset value. Therefore, the downside risk is limited. The whole industry trades between 20% to 50% below their net asset value, which can be attributed to the industry being in a 10-year bear market.

There are three different types of ships participating in the crude oil tanker market: The very large Crude Carrier (VLCC), the Suezmax, and the Aframax. These tankers have the capacity to hold 2 million barrels of oil, 1 million barrels of oil, and 750 thousand barrels of oil, respectively. Euronav currently owns 46 VLCCs and 25 Suezmax. These behemoth vessels have substantial fuel and depreciation costs.
Euronav has high operating leverage. Once the breakeven price of $15,000-25,000 per day (depending on fuel prices and ship ‘s size) is exceeded, all additional revenues translate into profits. Euronav estimates that they will increase EBITDA by $108 million for every $5,000 that the VLCC spot market increases beyond $25,000 (annualized). To add, these additional profits do not get taxed because Euronav, like most tanker companies, are registered in tax havens. Once rates average above $50,000 per day, the combination of the high operating leverage and the lack of taxes will directly benefit shareholders.
- Recent Developments
The coronavirus-induced lockdowns directly caused the world economy to reduce oil consumption significantly at the end of Q1 and the beginning of Q2 this year. However, production continued at similar rates causing there to be an excess supply of oil, and logically a need to store this oil. Once land storage facilities reached their capacity, oil producers turned to oil tankers as their storage site, and continue to do so to a lesser extent today. Euronav has given strong guidance on its Q2 which will be reported on August 6. In Q1, their revenue was $433 million, surpassing last year’s $233 million, and net income was $226 million, blowing last year’s net income of $20 million by factor of 11. Q2 has even better expectations due to tanker rates remaining high between April and June.
Historically, most of the shipping industry reports losses during Q3, making it the weakest season for most companies. However, counter-intuitively by historical standards, VLCC rates have been at a 5-year high for significant portions of July 2020. Historically Q4 has been the industry’s strongest season, which suggests Euronav will close the year reporting annual profits equal to roughly one-third of its current market cap.
An unforeseen recent development in the oil market has been the sub- 40-dollar barrel of oil. This unexpected decrease from March to May 2020 devastated many fracking companies’ balance sheets, perpetuating a wave of bankruptcies. This, consequently forced the cancellation of most of the US fracking industry capital expenditures for 2020 and 2021. This is extremely significant considering the average fracking well suffers 30% decreases in oil production per year. This depletion means that a well in its third year would produce around 50% of the oil it produced in year one. If the US fracking industry does not maintain pre-March production levels, then the US will be forced to import oil from the Arabian Gulf. In doing so, 60 VLCCs (~7.5% of the total VLCC fleet) will be needed for every 1 million barrels of oil the US imports. This new development can perpetuate the supercycle to occur earlier than what analysts expect.
THE INTRINSIC VALUE OF EURONAV (EURN)
The value of any business is its discounted future cash flow. Below are the last ten years of free cash flow for Euronav.
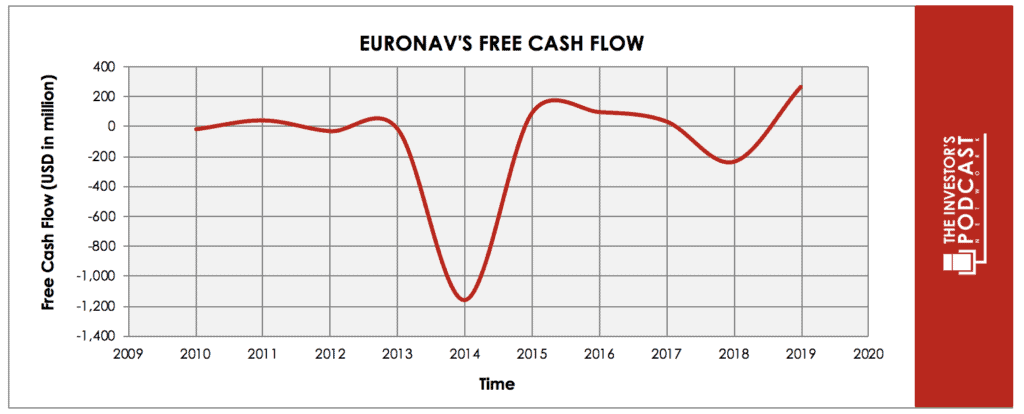
The chart below showcases that the oil tanker business is terrible over the long term. Many other oil tankers companies experienced similar results to those of Euronav. Over the past ten years, free cash flow was cumulatively negative for Euronav, which could be partially attributed to the fleet size doubling. Despite this, investors should remain wary of staying long in this industry for an extended period.
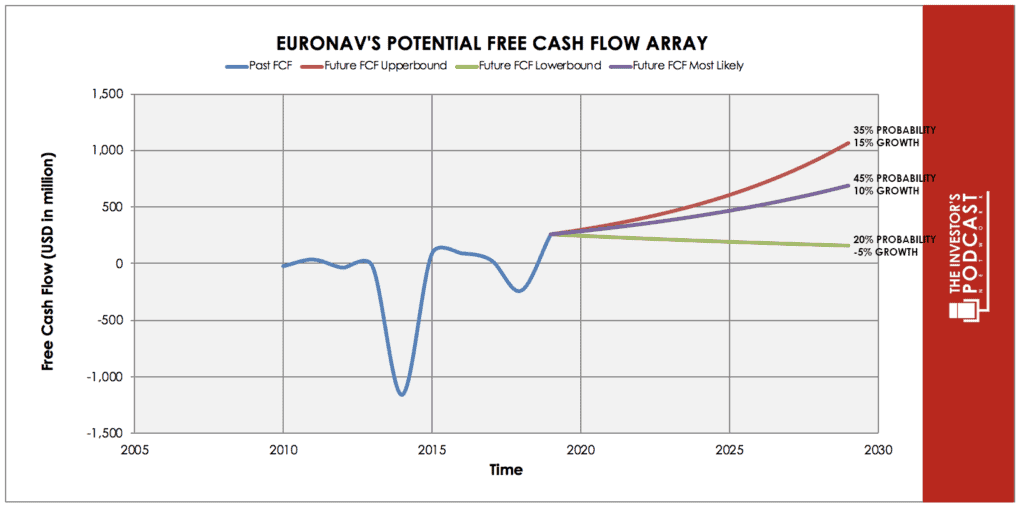
Above is the illustration of Euronav’s projected free cash flow for the next ten years. It is unreasonable to expect consistent linear growth in cash flows for an extended period because of the cyclical nature of the business. Rather, it is far more likely that the surge in cash flow will be concentrated in a specific period, similarly to how it occurred in a concentrated period during the supercycle from 2004 to 2008.
There is a 35% probability Euronav will exhibit its best-case scenario, a roughly 15% per annum cash flow increase over the next ten years. According to this projection, Euronav will have an inflow of $6.1 billion in free cash flow over the next ten years. Specifically, from Q4 2019 to Q4 2020, Euronav will most likely report $550 – $700 million in free cash flow. If the imminent supercycle begins between 2022 and 2023 and daily rates superseded $70,000; then Euronav’s EBITA would increase by over $1 billion throughout the supercycle years.
There is a 45% probability Euronav will exhibit its base-case scenario, a roughly 10% per annum cash flow increase over the next ten years resulting in a cumulative cash flow increase of roughly $4 billion. It is estimated the company will book a sixth of this projected cash flow this year. In this base case scenario, one can expect the supercycle to be one to years shorter than that in the best-case scenario because of massive increases in the fleet through the addition of new vessels.
There is a 20% probability Euronav will follow the worst-case scenario in which free cash flow will increase by -5% per annum. In this scenario, the supercycle would not happen because of state-sponsored overbuilding of oil tanker ships. Furthermore, the lingering effects of the coronavirus’ economic devastation would continue to subdue global oil demand. Industry-wide returns would be abysmal, resulting oil tankers continuing to trade at significant discounts to net asset value.

THE COMPETITIVE ADVANTAGE OF EURONAV (EURN)
Euronav has various competitive advantages outlined below:
- Strong Balance Sheet. Most of Euronav’s competitors have a debt to equity ratio above 1, while Euronav own is under 0.70, making it one of the least levered up industry players. This low debt to equity ratio permits Euronav to operate at lower costs relative to competitors, who also have higher interest rates.
- Management Capital Allocation. Management has been buying back shares from the market at near 52-week lows. In the past few weeks, management has repurchased over 3% of all outstanding shares. These purchases occurred when the company was trading at 20% to 40% below its net asset value. Thus, these purchases are highly accretive to shareholders.Euronav has committed that it will be paying out 80% of its earnings to shareholders in dividends. If the supercycle comes, the stock will yield 25% to 50% annually, if not more (for reference, see Frontline from 2002 to 2008).
- Newer Fleet. Euronav fleet’s average age is around 8.6 years, while the industry average is about ten years. Euronav’s VLCCs average age is closer to seven years, while Euronav’s Suezmaxs are approximately 11 years old. The larger, more expensive VLCCs are younger in age than their older and smaller Suezmaxs.
RISK FACTORS
- Overbuilding: Private Sector and State-Sponsored. Most of the shipyards that produce these oil tankers are based in Japan, South Korea, and China. These countries have a history of subsidizing their manufactures. State-sponsored enterprises and government agencies have lent money at subsidized rates to the manufacturers and their clients. This could lead to an overbuilding of ships, similar to 2015.In the shipping industry, companies are “serial diluters” and tend to overleverage their balance sheets to build new ships. Most management teams have little to no insider ownership; thus, growing the revenue usually translates into higher salaries. Luckily, reduced bank lending and a lack of enthusiasm in the capital markets have prevented the oil shipping companies from purchasing large swaths of new boats.
- Belgian Withholding Tax. Currently, when Euronav pays out a dividend, investors are subject to a 30% Belgian withholding tax. This tax can be sizable, given that Euronav’s preferred form of returning capital to shareholders is through dividends. American investors are entitled to a reduced rate given the US’s tax treaty with the Belgian government. This rate is around 15%.
OPPORTUNITY COSTS
In order to be a proficient capital allocator, an investor must take note of the opportunity cost.
At present, 10-year treasuries are yielding 0.54%, if we take inflation into account, the real return is likely negative. For riskier investments, like private equity, returns net of fees are around 15% to 20%. Thus, Euronav’s IRR of around 20.7% looks like an attractive investment given a similar risk level to private equity firms.
MACRO FACTORS
The International Maritime Organisation governs the rules of the shipping industry. This year a rule called IMO 2020 came into effect, which legislated that shipping companies have to burn more expensive low sulfur fuel to protect the environment. Alternatively, companies can pay millions of dollars to get scrubbers installed, allowing them to burn higher sulfur fuels. This would require that the vessels be parked at the dry dock for several months while the scrubbers get installed. While the ships get scrubbers, the fleet size is reduced by a small percentage. However, this can cause the spot market to increase because of the industry’s tight supply and demand balance. Recently, the spread between high sulfur fuel and low sulfur fuel hasn’t been large enough to justify making investments into scrubbers. Should the spread widen, new ships will be forced to get scrubbers, and old vessels will be scrapped sooner than expected.
IMO 2020 will be followed up by IMO 2030. These new rules are expected to establish new requirements for ships in order to reduce greenhouse gasses further. Currently, no agreement over the specific rules and standards have been reached. The decision to settle this uncertainty has been pushed back due to Coronavirus. This uncertainty is why the order book for the oil tanker industry is at a 20 year low. No bank wants to finance a $100 million ship with a 20-year life expectancy that would need to be scrapped or significantly retrofitted in 2030. Also, banks and shareholders are refusing to fund new orders because the industry was in a 10-year bear market. The last supercycle came to an end when the order book was 50% of the existing fleet. This oversupply meant that the industry hardly made any money. Usually, the fleet order has to be around 15% to 20% of the existing fleet to maintain balance. (The lead time to build ships is 18 months to 24 months.) Currently, the order book is around 9% to 11%, depending on the vessel type.
The supply situation is also impacted because the global oil tanker fleet’s age is one of the oldest in its history. Older ships tend to be more uneconomical. For the first 15 years of a ship’s life, a ship needs to get a survey once every five years, which costs between $1.5 to $3 million. After age 15, this same ship has to get one every 2.5 years, and it costs between $3 to $4 million. This is before one considers the lower charter prices offered for said vessels and less fuel-efficient engines. As of now, close to 6% of the global VLCC fleet is above 20 years old and an additional 19% will be within the next 5 years. These are strong scrapping candidates, as they are old and have no scrubbers. Once these vessels no longer have economic value, they are sold as scrap metal for $5 million to $15 million.
The last tailwind for the industry is geopolitical instability. Every country needs oil for its economy to operate. Sanctions, war, and other geopolitical instabilities mean that oil tankers must take more indirect and longer routes to deliver oil. This happened to Venezuela, which exported crude oil to the USA but now has to export its oil to Russia and China. In 2019, President Trump decided to sanction a Chinese company called COSCO. This resulted in about 40 vessels being barred from normally conducting oil tanker operations. This catalyst caused a spike in the spot market, with some ships getting paid nearly $300,000 per day. (In 60 days, this translates to around a 100% ROE)
People who are bearish on tankers think that there is a demand problem. Many countries have seen their economic output drop leading to less demand for oil. As of July, oil demand has bounced up as countries reopen, and people use cars instead of public transportation. Still, the US Energy and Information Administration expects that oil demand will not recover until 2021. Over the medium term, it projects that oil demand will increase as developing countries consume ever higher amounts of fuel for transportation. Over the past 15 years, oil demand has grown by over 1 million barrels per day. India and China (2 out of the 5 largest economies) have been growing their GDPs by over 6% annually, and they are massive oil importers.
Tanker bears also think that electric cars will reduce global oil demand. While this is true in the long run, the supercycle is expected to occur in the next few years. EV sales make up around 2.6% of total automobile sales. Their steeper prices mean that many would-be buyers are priced out. This is made worse because Coronavirus has severely hurt lower-upper income and middle-income earners.
SUMMARY
Euronav’s current share price offers prospective investors a multi-bagger return with a limited downside. The old age of the industry’s fleet combined with the low order book means that supply will be severely constrained in the coming years. This comes when oil shipping demand is expected to continue growing due to geopolitical instability, the fall of fracking, and growing demand in developing countries. These macro events are leading up to a potential supercycle and excess returns of patient inventors. However, historical poor capital allocation in the industry means that investors should be vigilant of the bull’s thesis, not playing out while also ignoring short-term stock volatility. Should the order book of new vessels increase dramatically, the supercycle will probably not occur. Investors should fasten their seat belts and be ready for a bumpy ride.
To learn more about intrinsic value, check out our comprehensive guide to calculating the intrinsic value of stocks.