Skip to content
 Intrinsic Value Assessment of Stellantis NV (STLA)
By Christoph Wolf From The Investor’s Podcast Network | 03 May 2023
INTRODUCTION
Stellantis NV (STLA) is a multinational automotive company that was formed in 2019 through a cross-border merger between Fiat Chrysler Automobiles (FCA) and the PSA Group (PSA).
The company is engaged in designing, engineering, manufacturing, distributing, and selling vehicles worldwide, which allow it to efficiently operate on a global scale. Its operations are split into five portfolios: 1) luxury vehicles (Maserati), 2) premium vehicles (Alfa Romeo, DS and Lancia), 3) global SUVs, 4) American brands (Dodge, Ram and Chrysler), and 5) European brands (Abarth, Citroën, Fiat, Opel, Peugeot and Vauxhall).
While the company operates all over the world, its two major markets are the US and Europe, where it is the 4th and 2nd largest automotive company, respectively, measured by new passenger vehicle market share. Its comparatively low focus on China makes it unique among most large automotive companies. This can be seen both as a weakness, since the China car market is large and growing fast, as well as a strength, because operating in China is very complex for a foreign company and requires constantly balancing the interests of the US and China because of their geopolitical rivalries.
Recent financial results were very impressive and the company trades at a very cheap valuation. It has a P/E of 2.74, a P/B of 0.64 and a forward dividend yield above 9%.
On the downside, the automotive industry faces a dramatic shift to Electric Vehicles (EVs) and is very competitive and capital intensive.
Is Stellantis a dream come true for any value investor or do the large risks and uncertainty outweigh the positives?
INTRINSIC VALUE OF STELLANTIS
When determining the intrinsic value of a company, the general approach is to use the company’s history of free cash flows. While Stellantis was only formed in 2019 by the merger of FCA and PSA, one can use historical data before 2019, because the merger was accounted for by Stellantis using the acquisition method of accounting.
Unfortunately, this only yields limited insights. To see why, let’s have a look at the following plot of historical free cash flows:
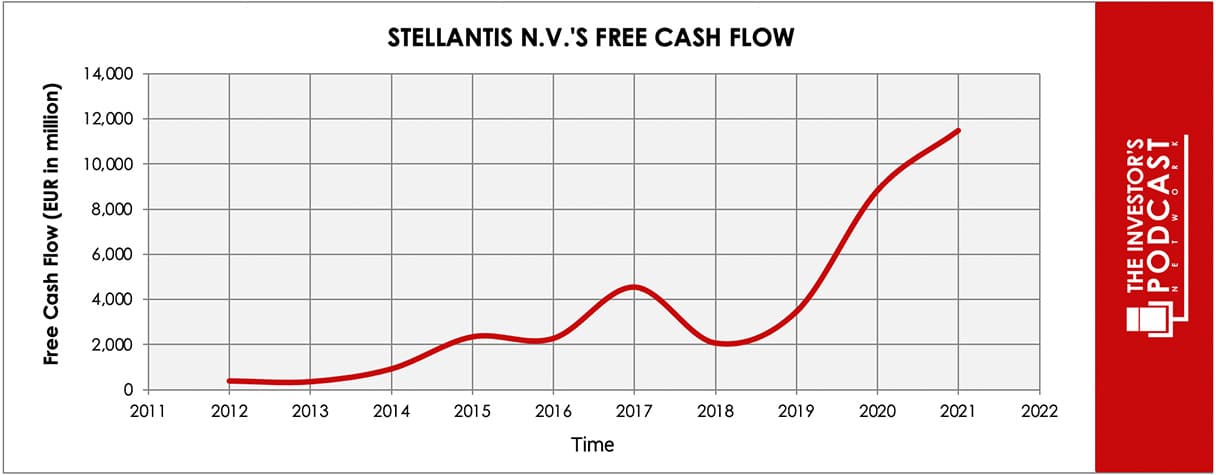
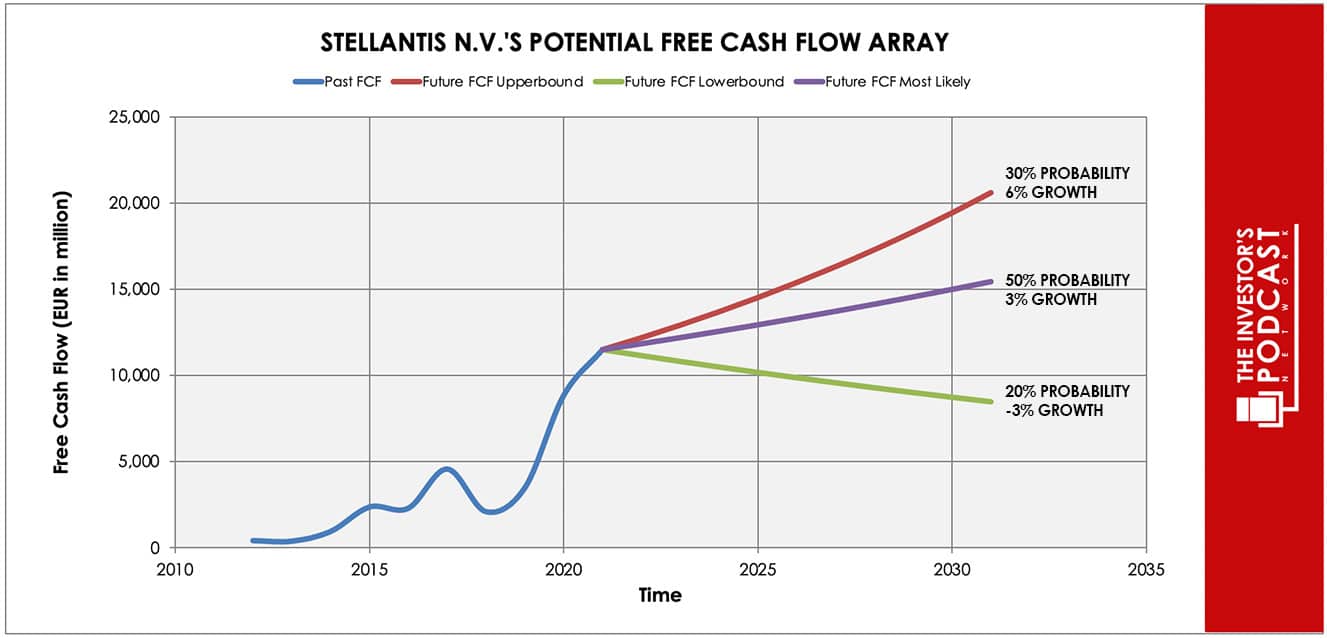
As one can see, it is very hard to predict the company’s prospects based on this chart. The last two years’ free cash flow rates were very high and it is unreasonable to extrapolate this into the future.
Assuming for example a 30% probability for the upper growth rate of 6% per year, a baseline scenario of 3% growth with a 50% probability, and a worst case of a decline of 3% annually (with a 20% chance), the expected annual return is 27.8%. This is obviously not realistic.
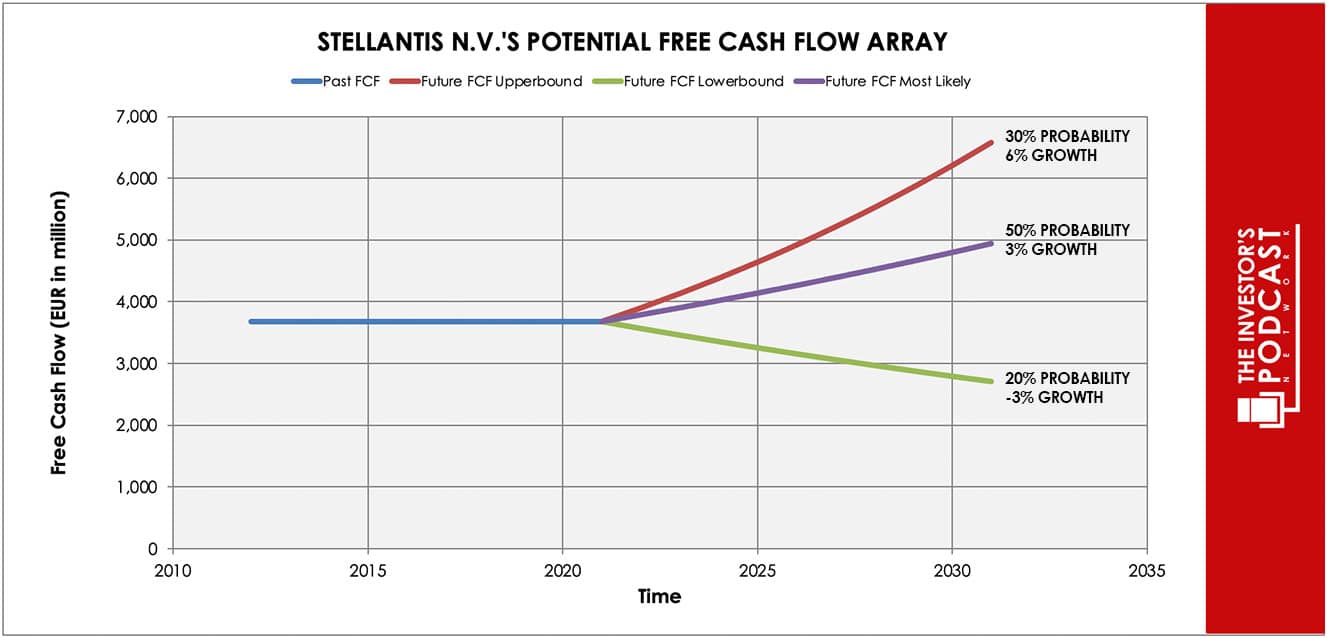
Therefore, we instead attempt to estimate the expected annual return by using the average of the FCF of the last 10 years, which results in a value of €3674 million. Using this as a starting point, we again assume the same probabilities and values for the best, baseline and worst case as above.
This approach results in an expected annual return of 8.6%.
Next, let’s investigate how these returns could be achieved.

THE COMPETITIVE ADVANTAGE OF STELLANTIS
Stellantis possesses some unique advantages that should allow it to be successful in the future:
- Size. The automotive industry is very capital intensive and requires a vast network of suppliers and integration. This is much easier to achieve for a vast company with multiple big car brands and deep pockets. What is more, the car industry is currently undergoing an immense transformation due to decarbonization efforts. The switch to electric vehicles will require vast financial and technological resources, which is much easier to achieve for a big automotive player like Stellantis. The company’s ambitious goal is for all its new vehicles in Europe and half its American output to be fully electric by 2030.
- Merger synergies. While a merger of two big companies such as FCA and PSA always includes many risks, the company expects to achieve huge synergies in areas such as technology, purchasing or Selling, General and Administrative Expenses (SG&A). And so far this has worked out even better than expected. At the end of 2022 the company has managed €7.1 billion of net cash synergies, which already exceeds the €5 billion annual target that had been aimed for in 2024.
- Strong and cheap fundamentals. Based on current fundamentals, the stock looks very cheap. The price/earnings ratio is 2.74, price/book equals 0.64 and the forward dividend yield is above 9%. Additionally, the financials look also very solid, which is indicated by a current ratio of 1.27 and a debt/equity ratio of 0.27 – which are good values for an automotive company.
When looking at various investing opportunities in the market today, let’s compare the expected return of Stellantis to other ideas. First, one could invest in the ten-year treasury bond which is producing a 3.49 % return. Considering the bond is completely impacted by inflation, the real return of this option is likely negative. Currently, the S&P 500 Shiller P/E ratio is 28.9. As a result, the US Stock market is priced at a 3.46% yield. If one were to invest in the S&P 500, they might purchase a low-cost ETF to take advantage of this return.
MACRO FACTORS
The automotive industry is currently experiencing one of its largest disruptions in its history. The effort to decarbonize the industry by switching to EVs will have a dramatic impact on carmakers’ business and very likely not all big car firms will survive. The rise of Tesla and BYD have already shown that business as usual is dead in the car industry. Decarbonization will require vast resources, completely new processes and comes with vast uncertainty.
Besides this, global car sales are highly dependent on the world economy and the geopolitical situation and are very hard to predict. Besides demand, also supply is hard to keep stable, since it depends on the state of global supply chains and the access to raw materials.
RISK FACTORS
There are several risks that might limit the growth prospects of STLA:
- Disruption due to electrification. The automotive industry is currently undergoing an immense shift due to the switch to electrification. From 2035 on, all new cars sold in the EU must be zero-emission vehicles and even conservative estimates assume that by 2040 about three quarters of all new-vehicle sales will be fully electric worldwide. Stellantis has not only to compete with the biggest car companies, but also with the leading EV-makers such as Tesla and BYD.
- Legacy competition. Besides competing with big EV-makers, Stellantis also faces strong competition from the largest legacy carmakers. In the US the biggest are GM, Toyota, Ford and Hyundai/Kia, while in Europe the largest competitors are Volkswagen and Renault.
- Cyclical business. The automotive industry is very cyclical and may have already peaked: While in 2017 73 million cars were sold worldwide, global car production has fallen to only 62 million in 2022. A saturated market, Covid-19, a worsening economic outlook and rising interest rates have all reduced demand for cars.
- Supply chain risks. The automotive industry is highly dependent on global supply chains, which in turn are shaped by geopolitics. Recently, a global microchip shortage has hampered the automotive industry, which risks reducing the company’s production output. Additionally, China controls most of the production capacity of lithium, graphite, and nickel which are needed for the batteries in EVs.
SUMMARY
Stellantis is an intriguing investment idea. On the on hand, the company’s fundamentals look very cheap and one can expect it to hold its ground against its traditional legacy competitors. The big unknown is the effect of the shift to electrification, which will completely transform the automotive industry. Investors should investigate more deeply, whether the company’s expected annual return of 8.9% sufficiently compensates for this risk.
To learn more about intrinsic value, check out our comprehensive guide to calculating the intrinsic value of stocks.
Disclaimer: The author does not hold ownership in any of the companies mentioned at the time of writing this article.