Skip to content
 Intrinsic Value Assessment Of Cummins Inc. (CMI)
By David J. Flood From The Investor’s Podcast Network | 30 January 2018
INTRODUCTION
Cummins Inc. is an American corporation whose principal business involves the design, manufacture, sale, and servicing of engines, filtration, and power generation products. The company serves its customers in over 190 countries and territories through a network of 600 company-owned and independent distributors and through 7400 dealerships. Cummins Inc. is currently a member of the Fortune 500 list with a market cap of $31.4 Billion. Its revenues and free cash flows for the previous financial year were around $17.5 Billion and $1.34 Billion respectively. The company’s common stock has fluctuated between a low of $140 and a high of $193 over the past 52 weeks and currently stands at around $191. Is Cummins Inc. undervalued at the current price?

THE INTRINSIC VALUE OF CUMMINS INC.
To determine the intrinsic value of Cummins Inc, we’ll begin by looking at the company’s history of free cash flow. A company’s free cash flow is the true earnings which management can either reinvest for growth or distribute back to shareholders in the form of dividends and share buybacks. Below is a chart of Cummins Inc.’s free cash flow for the past ten years.
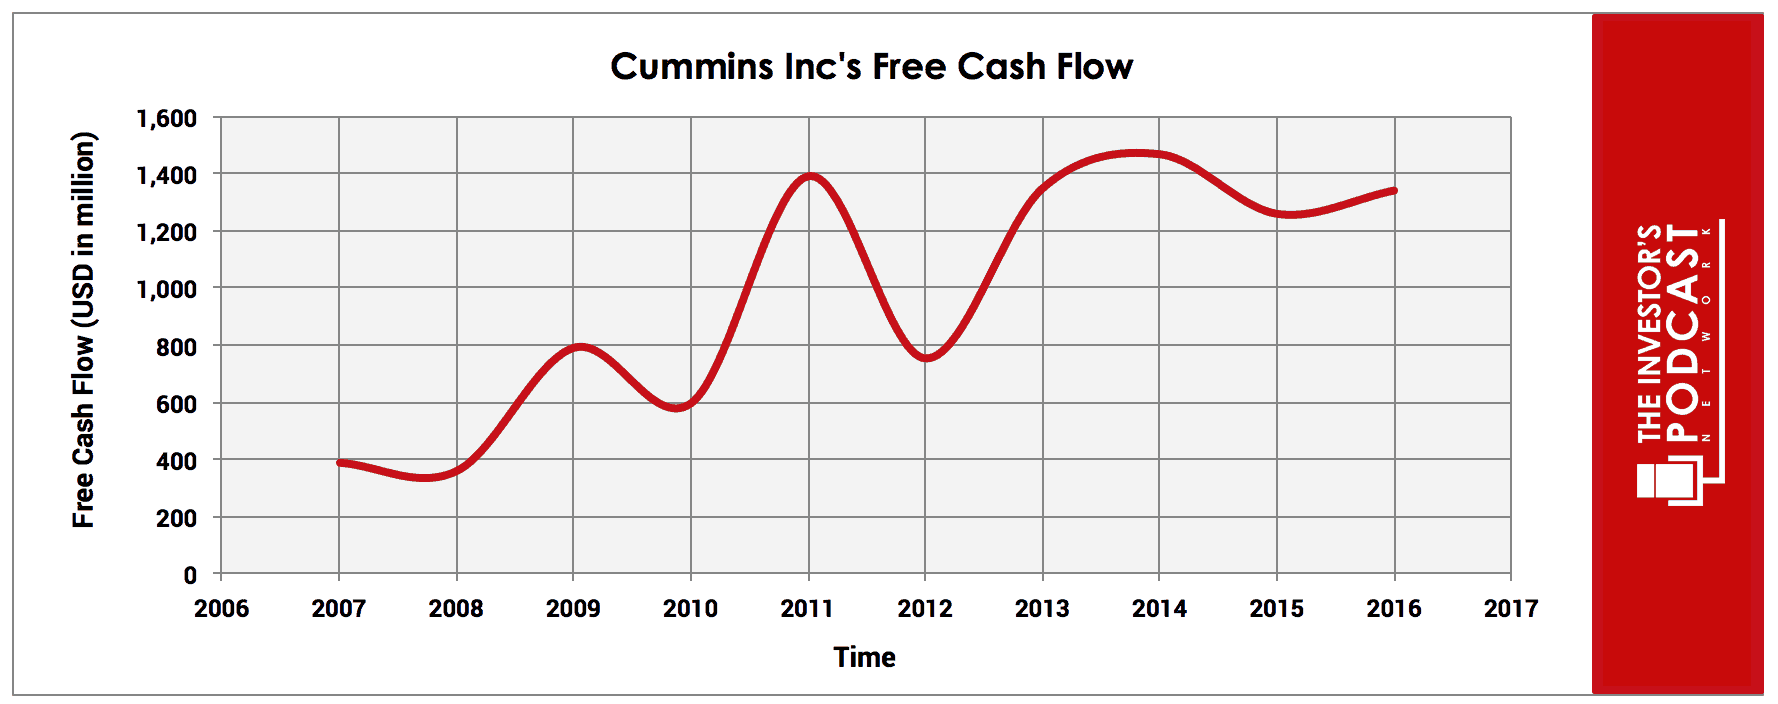
As one can see, while the company’s free cash flow has been growing over the past decade, it has been subject to cyclical pressures resulting in fluctuations. To capture a more accurate picture of long-term free cash flow growth, the author has opted to use the annualized average growth rate in free cash flow between 2000-2016 which is around 11%. To determine Cummins Inc.’s intrinsic value, an estimate must be made of its potential future free cash flows. To build this estimate, there is an array of potential outcomes for future free cash flows in the graph below.
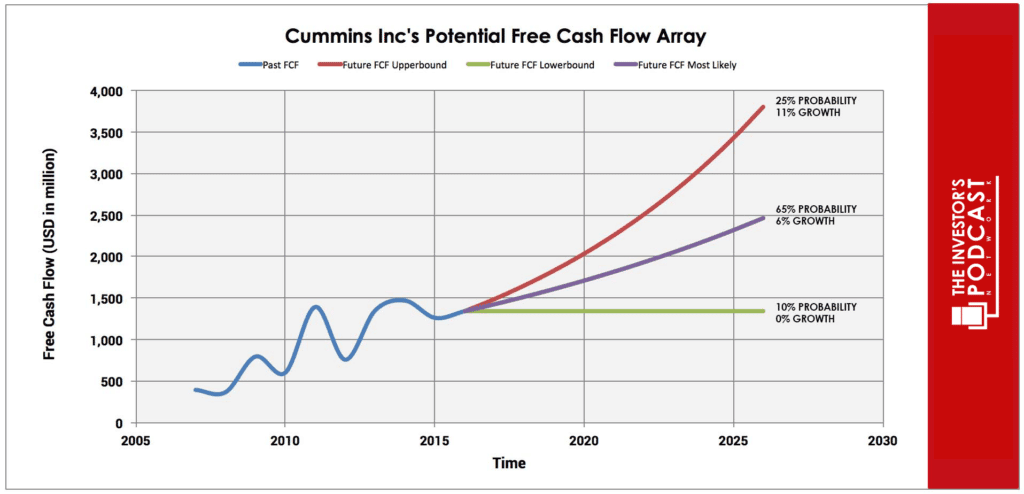
When examining the array of lines moving into the future, each one represents a certain probability of occurrence. The upper-bound line represents an 11% growth rate which is based on the company’s historical rate of free cash flow growth referenced above. Since the company’s business is somewhat exposed to cyclical pressure, the upper-bound rate has been assigned a 25% probability of occurrence to account for the possibility of an economic downturn within the next decade.
The middle growth line represents a 6% growth rate which is based on the company’s historical revenue growth rate. Revenues tend to be far more stable than earnings and offer a more realistic estimate of long-term future growth. For this reason, it has been assigned a 65% probability of occurrence.
The lower bound line represents a 0% growth rate in free cash flow growth and has been assigned a 10% probability of occurrence. This lower bound rate assumes that the company’s growth stagnates over the coming decade in the event of weakening global economic growth.
Assuming these potential outcomes and corresponding cash flows are accurately represented, Cummins Inc. might be priced at a 5.5% annualized return if the company can be purchased at today’s price. We’ll now look at another valuation metric to see if it corresponds to this estimate.
Based on Cummins Inc.’s current Earnings yield, which is the inverse of its EV/EBIT ratio, the company is projected to return 6.98%. This is below the firm’s 10-year historical median average of 9.7% suggesting that the company is overvalued relative to its historical average. Finally, we’ll look at Cummins Inc.’s Forward Rate of Return, a metric devised by Don Yacktman which measures normalized free cash flow plus real growth and inflation, to see what the projected future return might be. At the current market price, Cummins Inc. is projected to return 6.64% which is substantially below the firm’s 10-year median average of 18%.
Taking all these points into consideration, it seems reasonable to assume that Cummins Inc. is trading at a significant premium to fair value at present. Furthermore, the company may return around 5-6% at the current price if the estimated free cash flows are achieved. Now, let’s discuss how and why these free cash flows could be realized.

THE COMPETITIVE ADVANTAGE OF CUMMINS INC.
Cummins Inc. has various competitive advantages outlined below.
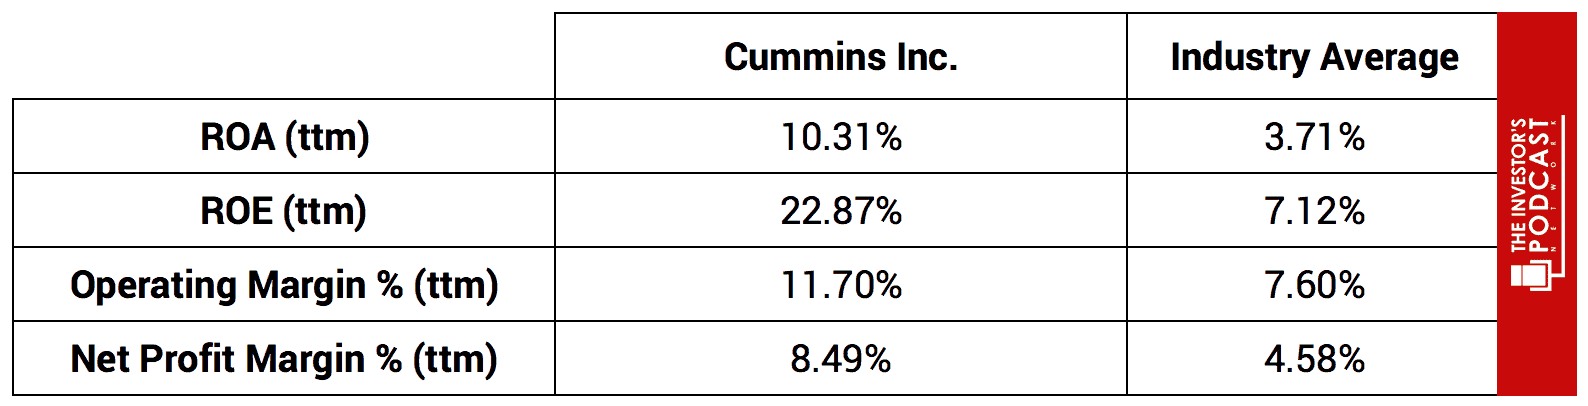
- Scale Advantage. Unlike its competitors, Cummins Inc. is the only independent manufacturer of engines. This has allowed the company to focus on building its scale advantage in this segment through much higher R+D investment into reducing emissions, enabling the company to provide a superior product than its competitors which has resulted in growing market share. This scale advantage also allows the firm to outperform its peers on a number of key performance metrics which can be seen in the table below.
- Niche Attribute. Unlike its integrated competitors who have opted for a ‘one size fits all’ approach to engine design, Cummins Inc. has opted to pursue a ‘fit-for-market’ approach instead. This allows the firm to tailor its engine design to the requirements of its customers in different regulatory and economic environments across the globe. In North America and Europe, emission regulations are a primary consideration for the company’s customers. In China and India, the primary consideration is cost. The ‘fit-for-market’ approach has enabled Cummins Inc. to penetrate foreign markets at a much faster rate than its peers since regional truck manufacturers are not required to alter their design specifications to fit with Cummins engine requirements. An example of this successful strategy is the fact that the firm has managed to grow its market share of the Chinese LCV (Light Commercial Vehicle) market from 1% in 2012 to 8% in 2017.
- Entrenched Customer Base. Since Cummins Inc. is the only independent engine provider in the United States, it has been able to focus on building a large distribution network which involves 600 company-owned and independent distributors and 7400 dealerships. This network of mechanics and engineers which are knowledgeable in Cummins engines can provide customers with unparalleled access to products, replacement parts, and after-care services with the greatest balance of cost versus quality.
CUMMINS INC.’S RISKS
Now that Cummins Inc.’s competitive advantages have been considered, let’s look at some of the risk factors which could impair my assumptions of investment return.
- While Cummins Inc. does possess multiple competitive advantages, there still exists a possibility that one of its rivals or a new entrant could mount a challenge to erode its competitive advantages and move on its market share. The barriers to entry in the markets in which Cummins Inc. operates have grown due to the increase in environmental regulations, but a number of industrial conglomerates do possess the necessary capital to mount a challenge.
- Cummins Inc. must maintain its track record of significant R+D spending to maintain a competitive advantage over its peers. Failure to do so would likely result in a narrowing of its product superiority regarding both performance and emissions levels.
- The emergence of a serious economic crisis similar to that witnessed in 2008 could materially impact the company’s revenues and profits leading to lower growth in the coming years. While Cummins Inc. possesses numerous competitive advantages, a major decline in global economic growth would be detrimental to the company’s economic performance given the cyclical nature of the industrials market in which it operates.
OPPORTUNITY COSTS
Whenever an investment is considered, one must compare it to any alternatives to weigh up the opportunity cost. At present, 10-year treasuries are yielding 2.66%. If we take inflation into account, the real return is likely to be closer to 1%. The S&P 500 Index is currently trading at a Shiller P/E of 34.8x, 107.1% higher than the historical mean of 16.8x. This gives the S&P500 an implied future annual return of -3.8% assuming reversion to the mean occurs. While Cummins Inc. appears to offer a higher rate of return than both U.S. Treasuries and the S&P 500, other individual stocks may be found which may offer a more favorable return relative to the risk profile.
MACRO FACTORS
Investors must consider macroeconomic factors that may impact economic and market performance as this could influence investment returns. At present, the S&P is priced at a Shiller P/E of 34.8x. This is 107.1% higher than the historical mean average of 16.8x, suggesting that markets are at elevated levels. U.S. unemployment figures are at a 30-year low suggesting that the current business cycle is nearing its peak. U.S. private debt/GDP currently stands at 199.6% and is at its highest point since 2009 when the last financial crisis prompted private sector deleveraging.
SUMMARY
The future for Cummins Inc. looks favorable if it can maintain its competitive advantages and adapt to the increasingly rapid rate of change in technology. The company appears to be preparing for the movement toward electrification of transportation and has recently previewed a prototype of an all-electric truck called the Concept Class 7 Urban Hauler EV. The company intends to start production of the driveline system and batteries in 2019 and supplying the technology to truck manufacturers shortly after that. Providing that the firm can successfully adapt its business model and transition into the EV market, its long-term economics should remain intact.
In the near-to-mid-term, the risk of an economic downturn is a growing concern given the historically high levels of debt present in the global economy. Cummins Inc.’s business is cyclical and would likely suffer in a recessionary environment. Regarding management’s performance and alignment with shareholders’ interests, historical results have been encouraging. Over the past ten years, the company has achieved a total shareholder return of 261% versus 104% for its peer group and 106% for the S&P 500. They have also grown the percentage of operating cash flow returned to investors from 33% between 2006-2008 to 66% between 2015-2017. In dollar terms, the past three-year cumulative returns in dividends and share buybacks was $4.2 Billion, and since 2006 the firm has reduced its share count by 18% and grown dividends by 1176%.
At present, Cummins Inc. appears moderately undervalued on a cash flow basis with an estimated return of around 5-6%. The length and valuation of the current bull market suggest that we are in or approaching the end-stage of an economic cycle. For this reason, the author recommends investors to wait for a more favorable entry point if considering an investment in Cummins Inc. While the firm’s long-term economics appear favorable, its mid-term performance is likely to suffer if a recessionary environment returns despite its strong niche position.
To learn more about intrinsic value, check out our comprehensive guide to calculating the intrinsic value of stocks.