Skip to content
 Intrinsic Value Assessment Of Fonar Corporation (FONR)
By David J. Flood From The Investor’s Podcast Network | 30 October 2018
INTRODUCTION
Fonar Corporation is a U.S. based technology company whose principal business involves the design, manufacture, sale, and servicing of magnetic resonance imaging (MRI) scanners. At the time of writing, the firm’s market cap stands at around $155 Million and its revenues and free cash flows for the previous financial year were around $82 Million and $16 Million respectively. The company’s common stock has fluctuated between a high of $33.75 and a low of $21.10 over the past 52 weeks and currently stands at $23.92. Is Fonar Corporation undervalued at the current price?

THE INTRINSIC VALUE OF FONAR CORPORATION
To determine the intrinsic value of Fonar Corporation, we’ll begin by looking at the company’s history of free cash flow. A company’s free cash flow is the true earnings which management can either reinvest for growth or distribute back to shareholders in the form of dividends and share buybacks. Below is a chart of Fonar Corporation’s free cash flow for the past ten years.
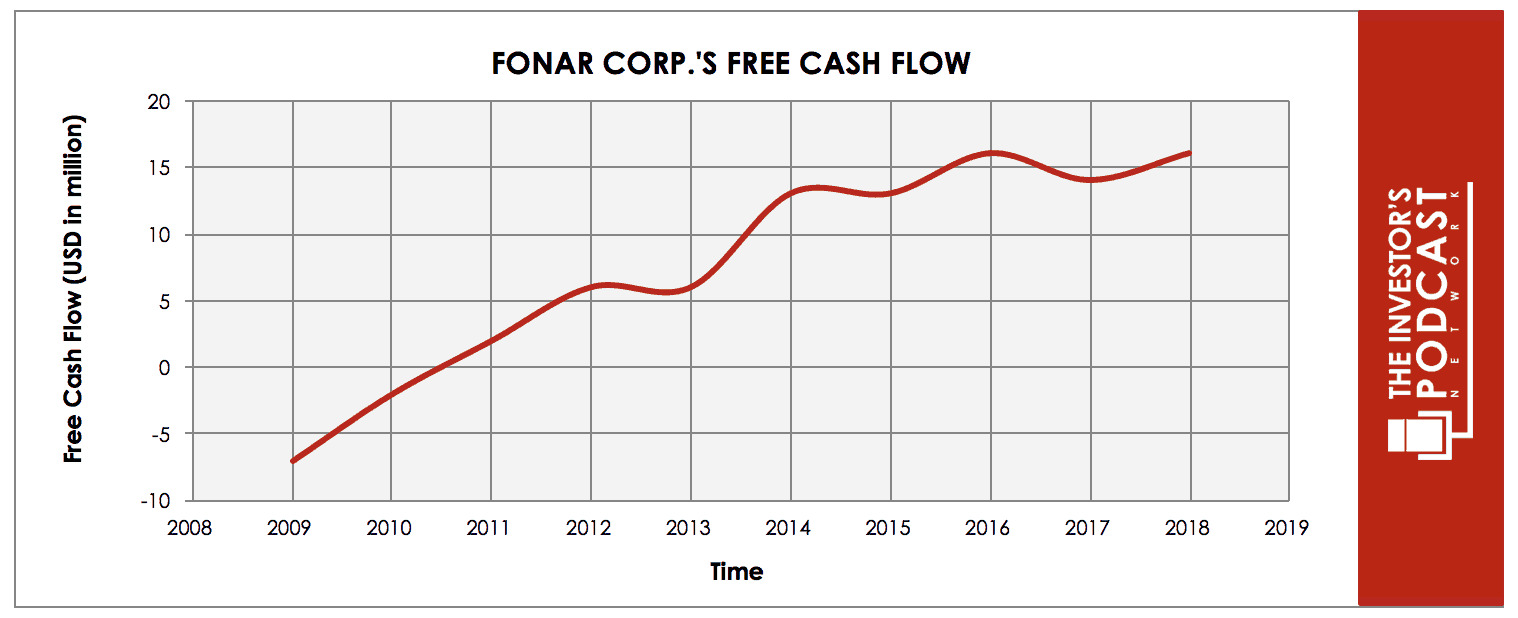
As one can see, the company’s free cash flow has grown substantially over the past decade, after making losses in 2009-2010, the firm has grown free cash flow at an annualized rate of around 34% between 2011-2018. In order to determine Fonar Corporation’s intrinsic value, an estimate must be made of its potential future free cash flows. To build this estimate, there is an array of potential outcomes for future free cash flows in the graph below.
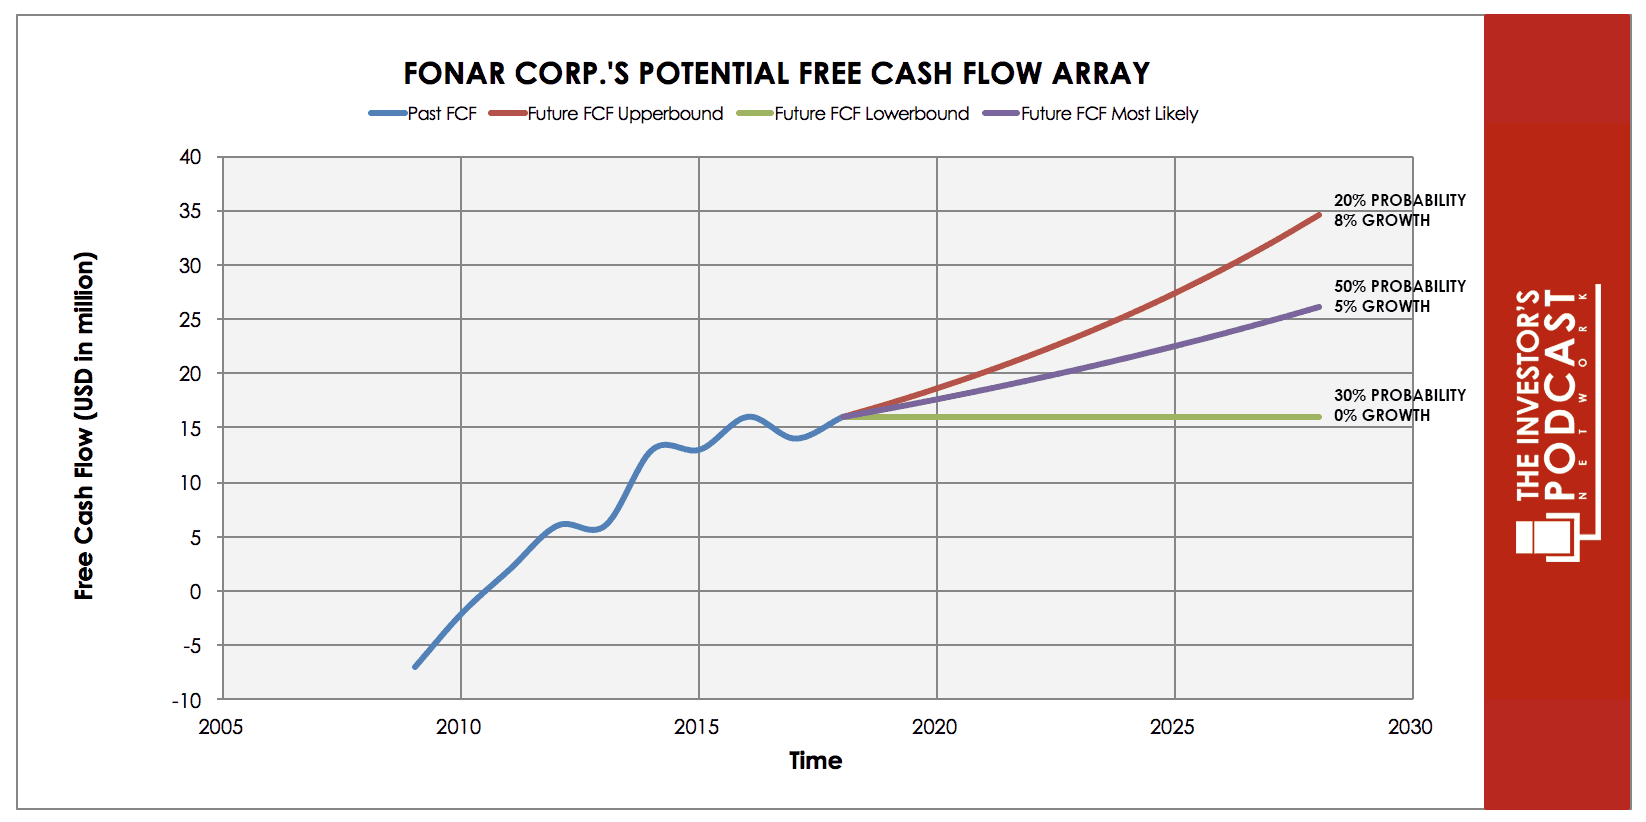
When examining the array of lines moving into the future, each one represents a certain probability of occurrence. The upper-bound line represents an 8.2% growth rate which assumes that the firm’s future free cash flow growth tracks MRI market growth rate projections for the period 2018-2025. This upper growth line has been assigned a 20% probability of occurrence to account for the possibility of mounting competitive pressures and a narrowing of Fonar Corporation’s moat. The middle growth line represents a 4.5% growth rate which assumes free cash flow tracks CMS office projections for U.S. health care spending growth free cash flow growth rate for the period 2017-2025. This growth rate has been assigned a 50% probability of occurrence. The lower bound line represents a 0% rate in free cash flow growth and assumes that the company suffers a period of stagnation in earnings due to competitive and cyclical pressures. This growth rate has been assigned a 30% probability of occurrence.
Assuming these potential outcomes and corresponding cash flows are accurately represented, Fonar Corporation might be priced at a 13.6% annual return if the company can be purchased at today’s price. We’ll now look at some other valuation metrics to see if they correspond with this estimate. Fonar Corporation’s current earnings yield, which is the inverse of its EV/EBIT ratio, is 14.37% which is above the industry median of 0.74% and the firm’s historical median average of 12.50% suggesting that Fonar Corporation may be undervalued relative to the industry and its historical average.
Finally, we’ll look at Fonar Corporation’s free cash flow yield, a metric which assumes zero growth and simply measures the firm’s trailing free cash against its current market price. At the current market price, Fonar Corporatoin has a free cash flow yield of around 19.51%.
Taking all these points into consideration, it seems reasonable to assume that Fonar Corporation may currently be trading at a discount to its peers and the global medical devices market. Furthermore, the company may return between 13-14% at the current price if the estimated free cash flows are achieved. Now, let’s discuss how and why these estimated free cash flows could be achieved.

THE COMPETITIVE ADVANTAGE OF FONAR CORPORATION
Fonar Corporation has various competitive advantages outlined below.
- Niche Attribute. Fonar Corporation’s former CEO and current chairman Raymond Damadian was the inventor of the MRI scanner in 1972, and he subsequently founded Fonar Corporation in 1978. More recently, Fonar Corporation invented and patented the upright MRI scanner which allows the patient to sit, stand, bend, or lay while receiving a scan. This patented technology grants the company with a niche attribute since the upright machine is a more comfortable experience for patients to use and allows for patients to be scanned in weight-bearing positions which can aid diagnosis of particular injuries and ailments.
- Intangible Assets. Fonar Corporation holds a portfolio of 209 patents related to its MRI technology including those related to the firm’s unique upright MRI scanning technology. While the company has cross-licensing agreements on some of its patents, it has thus far not engaged in any licensing agreements pertaining to its upright MRI technology. This further strengthens the firm’s competitive advantage.
- Sticky Business Model. Fonar Corporation derives a large proportion of its revenue and earnings from patient fees, management, maintenance, and serving business which is conducted by the company’s subsidiary, Health Management Corporation of America (HMCA). These revenue and earnings streams are recurring since clients are not inclined to switch management providers due to the high associated costs, this leads to a sticky business model.
These competitive advantages have allowed Fonar Corporation to outperform the NASDAQ, NAS-Med, and NAS-Hea indexes for the last several years.
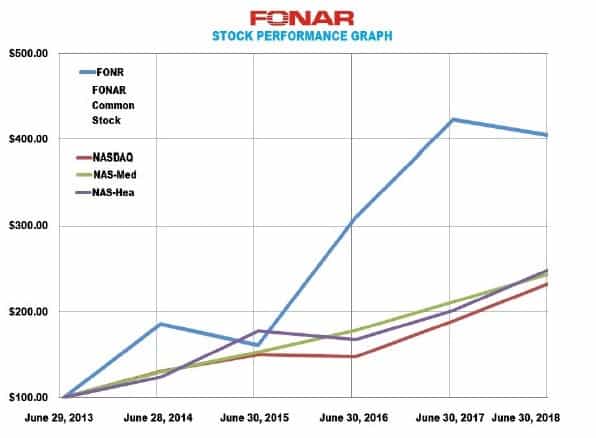
Source: Fonar Corporation 2018 Annual Report
FONAR CORPORATION’S RISKS
Now that Fonar Corporation’s competitive advantages have been considered, let’s look at some of the risk factors that could impair my assumptions of investment return.
- Fonar Corporation’s equipment business has been in decline for quite some time now with machine sales have fallen from over $9 Mil in 2010 to $0.6 Mil in 2018. Thankfully, the firm’s management and services business has more than made up for this, but it could suggest that the machine sales segment is unlikely to generate meaningful future income.
- Fonar Corporation’s competitors include heavy hitters such as GE, Siemens, Toshiba, and These firms are much larger in size and thus possess much greater resources which can be directed at R&D and marketing. Given Fonar Corporation’s small-capitalization, there exists the possibility that a competitor may try to snuff the company out.
- The implementation of Obamacare has seen reimbursement rates to MRI centers fall thus lowering fees paid to Fonar Corporation. It remains to be seen how health care legislation will evolve over the coming years, and there can be no guarantee that regulatory pressures will subside.
OPPORTUNITY COSTS
Whenever an investment is considered, one must compare it to any alternatives to weigh up the opportunity cost. At the time of writing, 10-year treasuries are yielding 3.07%. If we take inflation into account, the real return is likely to be closer to 1%. The S&P 500 Index is currently trading at a Shiller P/E of 30.6 which is 81.8% higher than the historical mean of 16.9. Assuming reversion to the mean occurs, the implied future annual return is likely to be -1%. Fonar Corporation, therefore, appears to offer a much better return for investors at present, but other individual stocks may be found which offer a similar return relative to the risk profile.
MACRO FACTORS
Investors must consider macroeconomic factors that may impact economic and market performance as this could influence investment returns. At present, the S&P is priced at a Shiller P/E of 30.6. This is 81.8% higher than the historical average of 16.9 suggesting markets are at elevated levels. U.S. unemployment figures are at a 30-year low suggesting that the current business cycle is nearing its peak. U.S. private debt/GDP currently stands at 202.80% and is at its highest point since 2009 when the last financial crisis prompted private sector deleveraging.

Source: Fonar News Release – February 23, 2005
SUMMARY
Fonar Corporation appears to be selling at a discount to fair value after the recent market sell-off. While machine sales have declined income from patient fees, maintenance and servicing have seen revenues and earnings continue to rise. Healthcare spending as a proportion of GDP is projected to rise from the 2016 level of 17.9% to 19.7% by 2026. Health spending is also projected to grow at 1% faster than GDP between now and 2026 meaning a worst-case growth rate of 4-5% is highly likely. If Fonar Corporation can match or outpace MRI Scanner growth projections of around 8%, it could easily provide market-beating returns in the coming years.
With regards to financial stability, the firm is currently in a strong position with virtually no debt and a current and quick ratio of 4.60 and 4.41 respectively. Cash and equivalents currently stand at $19.6 Million meaning the possibility for accretive acquisitions without recourse to debt financing is open along with the potential for future dividend distributions.
In summary, Fonar Corporation appears to be a financially strong company with favorable future growth prospects. The firm currently possesses a narrow economic moat stemming from intangible assets, niche attributes, and a sticky business model. Fonar Corporation’s moat is likely to be maintained in the near-to-mid-term, but the risk exists that a larger competitor could seek to move on the firm’s market share.
Book value per share currently stands at $15.22 which equates to around 63% of the current share price. This offers a reasonable floor for the stock, and if current free cash flows can be maintained, then investors have the potential to achieve annualized double-digit returns over the next decade. Based on the conservative assumptions used in the analysis of the company, Fonar Corporation may return around 13-14% at the current market price.
To learn more about intrinsic value, check out our comprehensive guide to calculating the intrinsic value of stocks.
Disclaimer: The author does not hold ownership in any of the companies mentioned at the time of writing this article.