Skip to content
 Intrinsic Value Assessment Of Interdigital Inc. (IDCC)
By David J. Flood From The Investor’s Podcast Network | 15 May 2018
INTRODUCTION
InterDigital Inc. is an American-based mobile technology company whose principal business involves the research and development of wireless technologies for mobile devices, networks, and services worldwide. The firm’s market cap currently stands at around $2.68 Billion and its revenues and free cash flows for the previous financial year were around $533 Million and $279 Million respectively. The company’s common stock has fluctuated between a high of $88 and a low of $68 over the past 52 weeks and currently stands at around $77. Is InterDigital Inc. undervalued at the current price?

THE INTRINSIC VALUE OF INTERDIGITAL INC.
To determine the intrinsic value of InterDigital Inc., we’ll begin by looking at the company’s history of free cash flow. A company’s free cash flow is the true earnings which management can either reinvest for growth or distribute back to shareholders in the form of dividends and share buybacks. Below is a chart of InterDigital Inc.’s free cash flow for the past ten years.
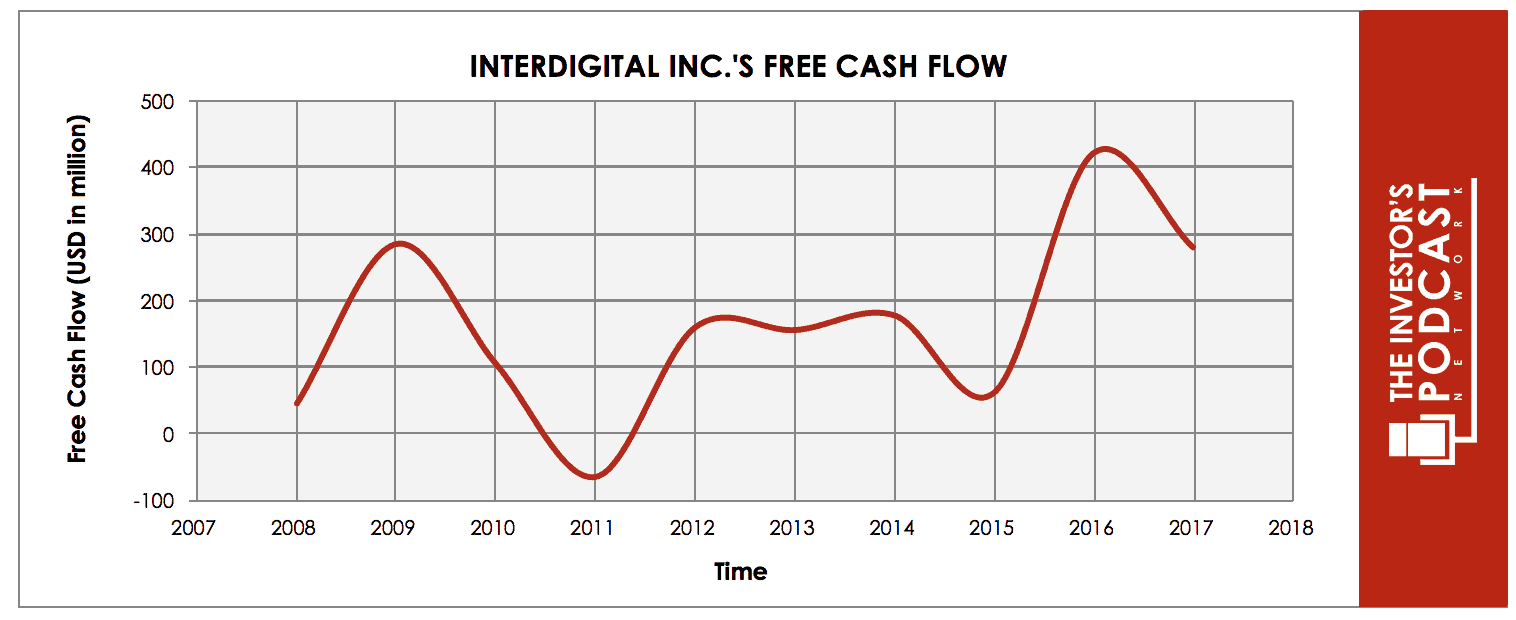
As one can see, the company’s free cash flow has been lumpy over the past decade which is a result of the fact that some of the firm’s royalties for patent license agreements take the form of royalty-bearing agreements while others are on a paid-up-front basis. Furthermore, in some years, more licensing agreements come up for renewal which leads to fluctuations in revenues and earnings. To determine InterDigital Inc.’s intrinsic value, an estimate must be made of its potential future free cash flows. To build this estimate, there is an array of potential outcomes for future free cash flows in the graph below.
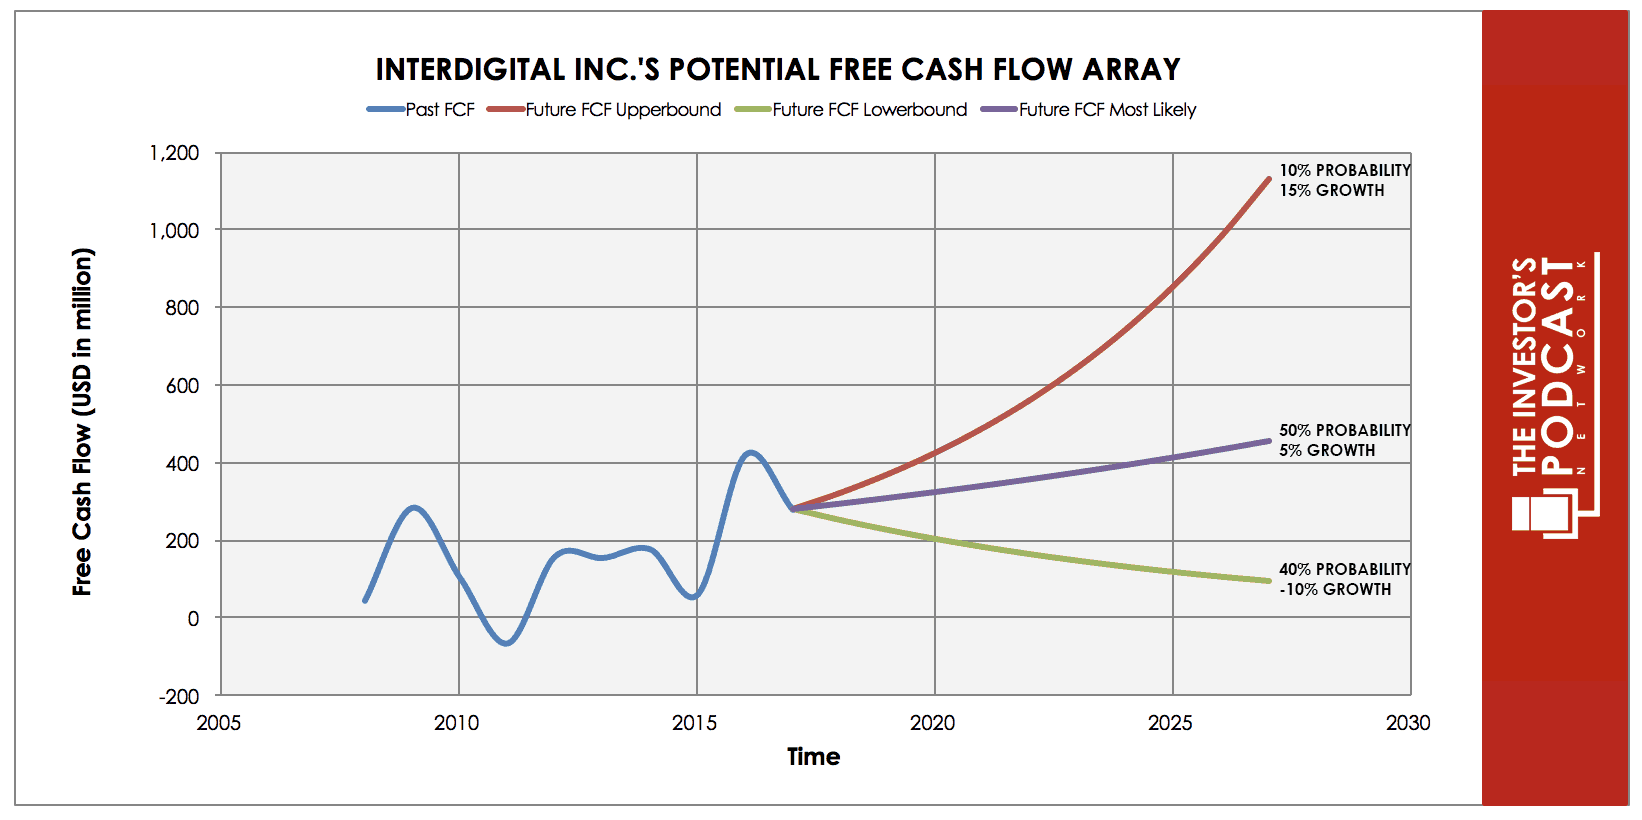
When examining the array of lines moving into the future, each one represents a certain probability of occurrence. The upper-bound line represents a 15% growth rate which the author has used instead of InterDigital Inc.’s 22% growth rate for the last ten years. This is because companies can seldom maintain such a high growth rate for prolonged periods. This growth rate has been assigned a 10% probability of occurrence to account for some factors including the rapid rate of change within the technology industry, the high level of competition, and the fact that three of InterDigital Inc.’s license agreements are set to expire in 2018.
The middle growth line represents a 5% growth rate which is based on the firm’s historical revenue growth for the previous ten years less 5% to account for fluctuations in revenues and earnings. This has been used as earnings tend to revert toward this rate of growth as a company matures. This scenario has been assigned a 50% probability of occurrence in light of the potential risks outlined above.
The lower bound line represents a -10% rate in free cash flow growth and assumes that the company suffers a contraction in earnings due to competitive pressure or the loss of major clients. This growth rate has been assigned a 40% probability of occurrence.
Assuming these potential outcomes and corresponding cash flows are accurately represented, InterDigital Inc. might be priced at an 11% annual return if the company can be purchased at today’s price. We’ll now look at another valuation metric to see if it corresponds with this estimate.
Based on InterDigital Inc’s current earnings yield, which is the inverse of its EV/EBIT ratio, the company is currently yielding 16.34%. This is below the firm’s 10-year historical median of 12.90%. The Global Telecom Services Industry median average of 4.49% suggesting that the company may be undervalued relative to its historical and industry comparisons. Finally, we’ll look at InterDigital Inc.’s free cash flow yield, a metric which assumes zero growth and simply measures the firm’s trailing free cash against its current market price. At the current market price, InterDigital Inc. has a free cash flow yield of 11.25%.
Taking all these points into consideration, it seems reasonable to assume that InterDigital Inc. is currently trading below fair value. Furthermore, the company may return around 11% at the current price if the estimated free cash flows are achieved. Now, let’s discuss how and why these estimated free cash flows could be achieved.

THE COMPETITIVE ADVANTAGE OF INTERDIGITAL INC.
InterDigital Inc. has various competitive advantages outlined below.
- Intangible Assets. InterDigital Inc. owns a portfolio of patents which includes approximately 2,400 U.S. patents and around 11,500 non-U.S. payments which are related to fundamental technologies that enable wireless communications. The company considers this suite and the 5,300 patents pending to be essential to cellular and other wireless standards including 3G, 4G, and 5G.
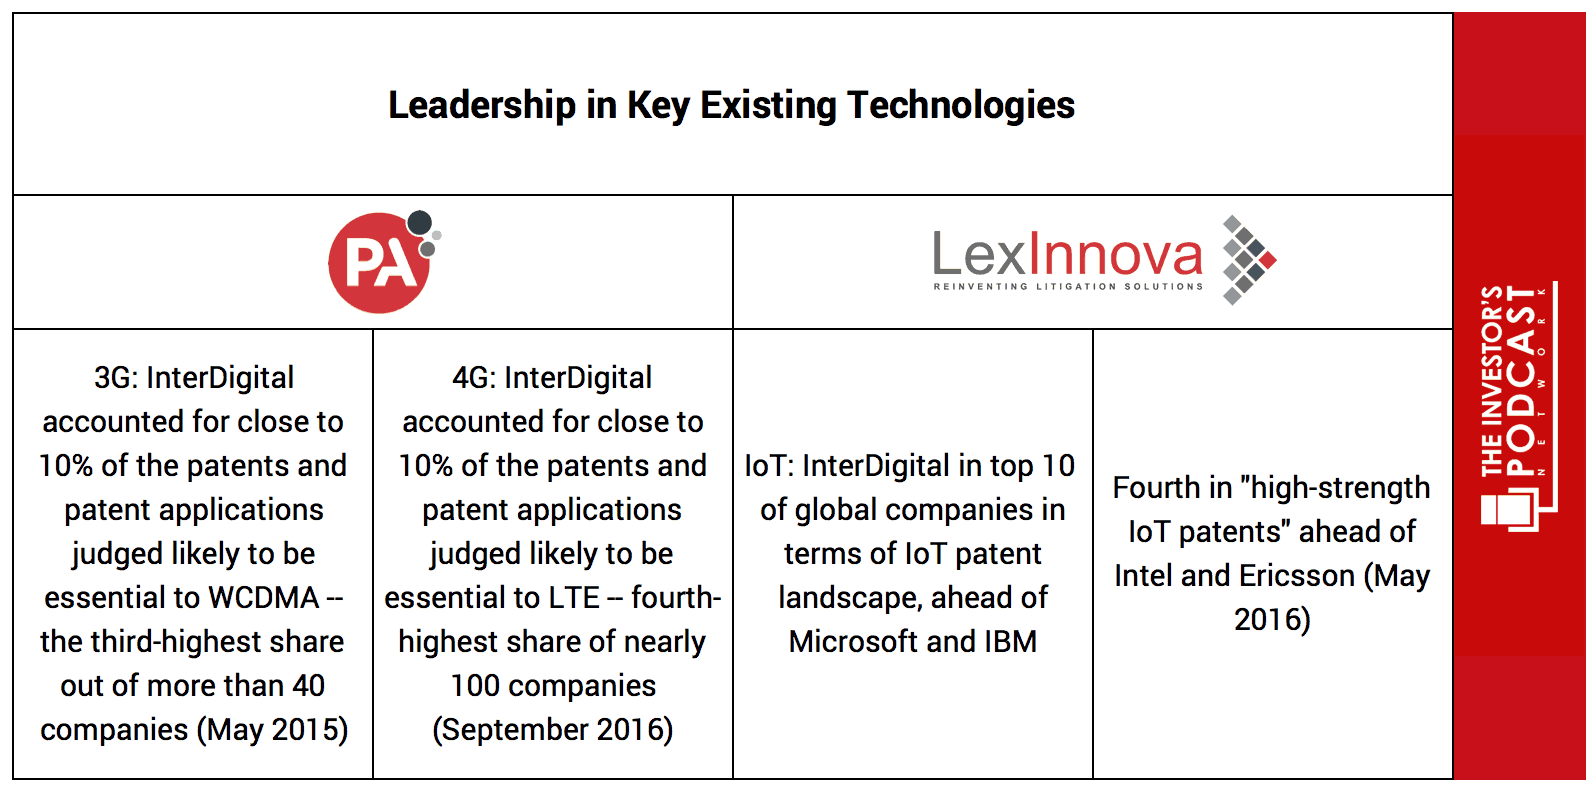
Figure 1: IDCC 2018 Presentation, Needham Growth Conference
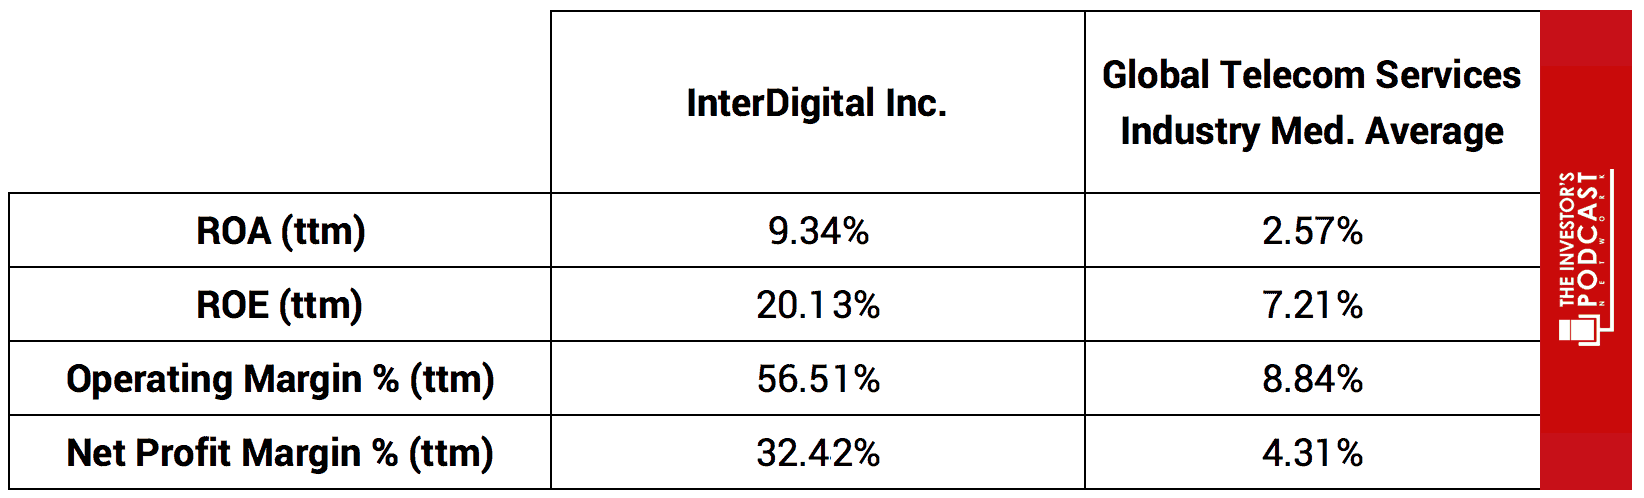
By aggressively defending these intangible assets and licensing them to clients like Apple and Samsung, the company can outperform the industry on a number of key metrics which can be seen below.
- Niche Attribute. By establishing collaborative relationships with key industry players and international standards bodies, InterDigital Inc. has embedded itself into the standards process thereby ensuring intellectual property. This is developed to become integral to the standards adopted by a variety of technologies including 3G, 4G and the emerging technologies such as 5G and the Internet of Things (IoT).

Figure 2: IDCC 2018 Presentation, Needham Growth Conference
- Sticky Business Model. Through the development of its patent portfolio and its entrenchment in the standards process, InterDigital Inc. has developed a sticky business model. This ensures that it has a long-term and diverse client base of licensees.
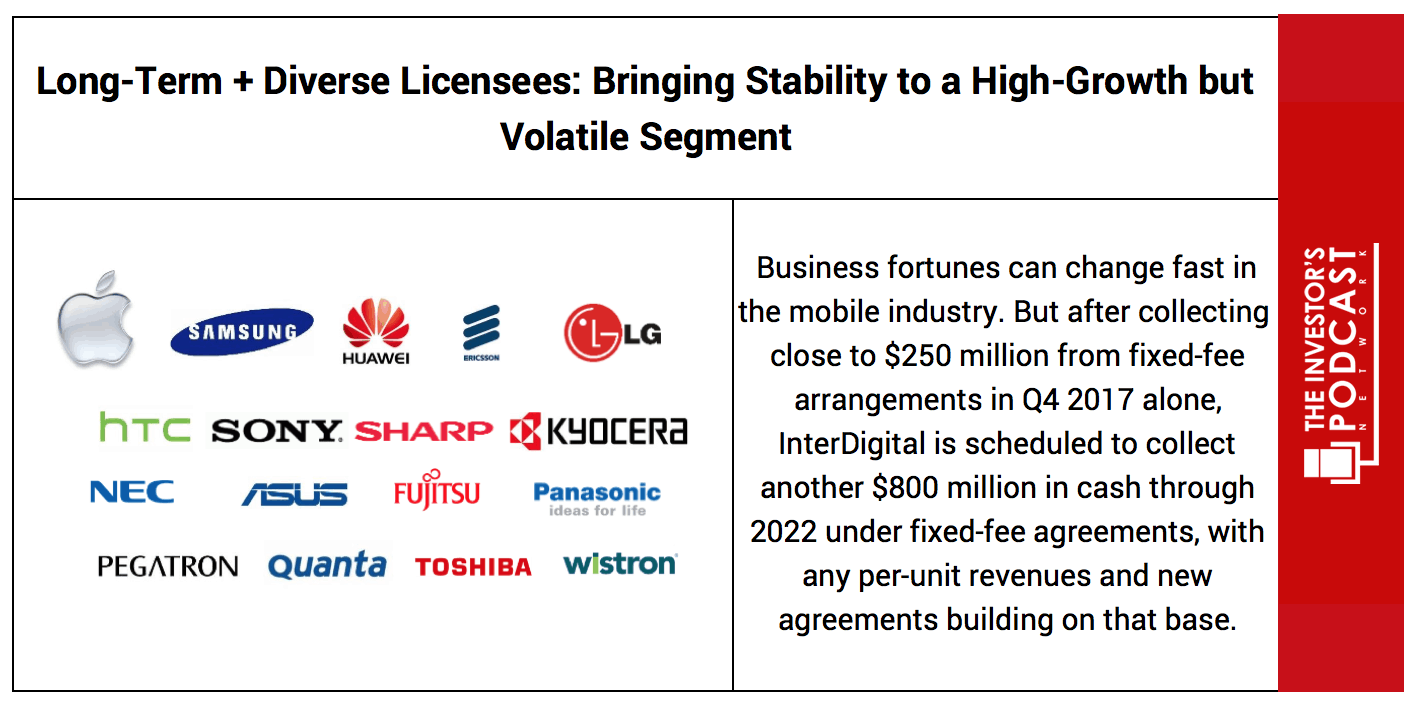
Figure 3: IDCC 2018 Presentation, Needham Growth Conference
INTERDIGITAL INC.’S RISKS
Now that InterDigital Inc.’s competitive advantages have been considered, let’s look at some of the risk factors that could impair my assumptions of investment return.
- While InterDigital Inc. has a broad client base of licensees, it still derives a significant proportion of its revenues and earnings from the top players in the industry. Apple, Huawei, Samsung, and Blackberry comprised approximately 21%, 14%, 13% and 13% of the firm’s total 2017 revenues respectively. A loss of one or more of these customers would likely impair the company’s future performance, but this is unlikely to occur in the near to mid-term since InterDigital Inc. is so embedded in the industry and currently has multi-year agreements in place with these clients.
- The technology industry is subject to a rapid rate of change where game-changing technologies can emerge which have disruptive effects. There is no guarantee that InterDigital Inc., will not, at some point in the future, be subject to such disruptive forces which lessen the value of its intangible assets or render its intellectual property obsolete.
- There is concern amongst some healthcare groups that wireless technology may possess the potential to be a health hazard for humans and the environment. Should these concerns gain large public support or be validated by a large body of conclusive scientific data, InterDigital Inc. could see demand for its intellectual property decline leading to an impairment of future revenues and earnings.
OPPORTUNITY COSTS
Whenever an investment is considered, one must compare it to any alternatives to weigh up the opportunity cost. At present, 10-year treasuries are yielding 2.96%. If we take inflation into account, the real return is likely to be closer to 1%. The S&P 500 Index is currently trading at a Shiller P/E of 31.4 which is 85.8% higher than the historical mean of 16.8. Assuming reversion to the mean occurs, the implied future annual return is likely to be -2.5%. InterDigital Inc., therefore, appears to offer a much better return for investors at present, but other individual stocks may be found which offer a similar return relative to the risk profile.
MACRO FACTORS
Investors must consider macroeconomic factors that may impact economic and market performance as this could influence investment returns. At present, the S&P is priced at a Shiller P/E of 31.4. This is 85.8% higher than the historical average of 16.8 suggesting markets are at elevated levels. U.S. unemployment figures are at a 30-year low suggesting that the current business cycle is nearing its peak. U.S. private debt/GDP currently stands at 199.6% and is at its highest point since 2009 when the last financial crisis prompted private sector deleveraging.
SUMMARY
InterDigital Inc. currently appears to be entrenched in the wireless communications industry occupying an integral role in the standards process and possessing a portfolio of patents which are essential to its client base. Future growth prospects appear favorable with many segments within the industry predicted to experience significant growth in the coming years.
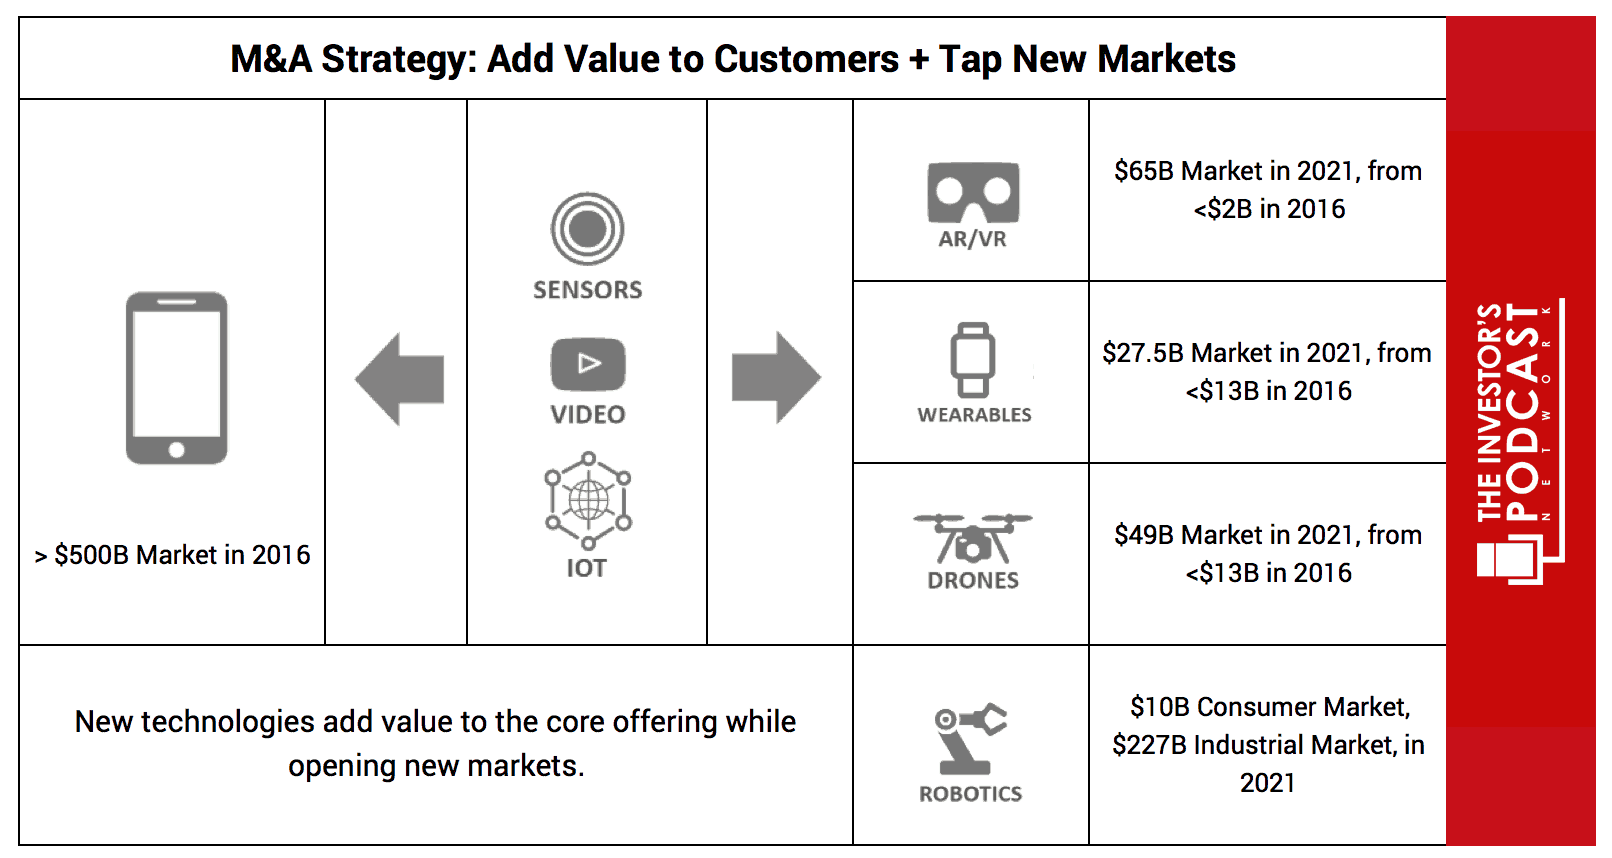
Figure 4: IDCC 2018 Presentation, Needham Growth Conference
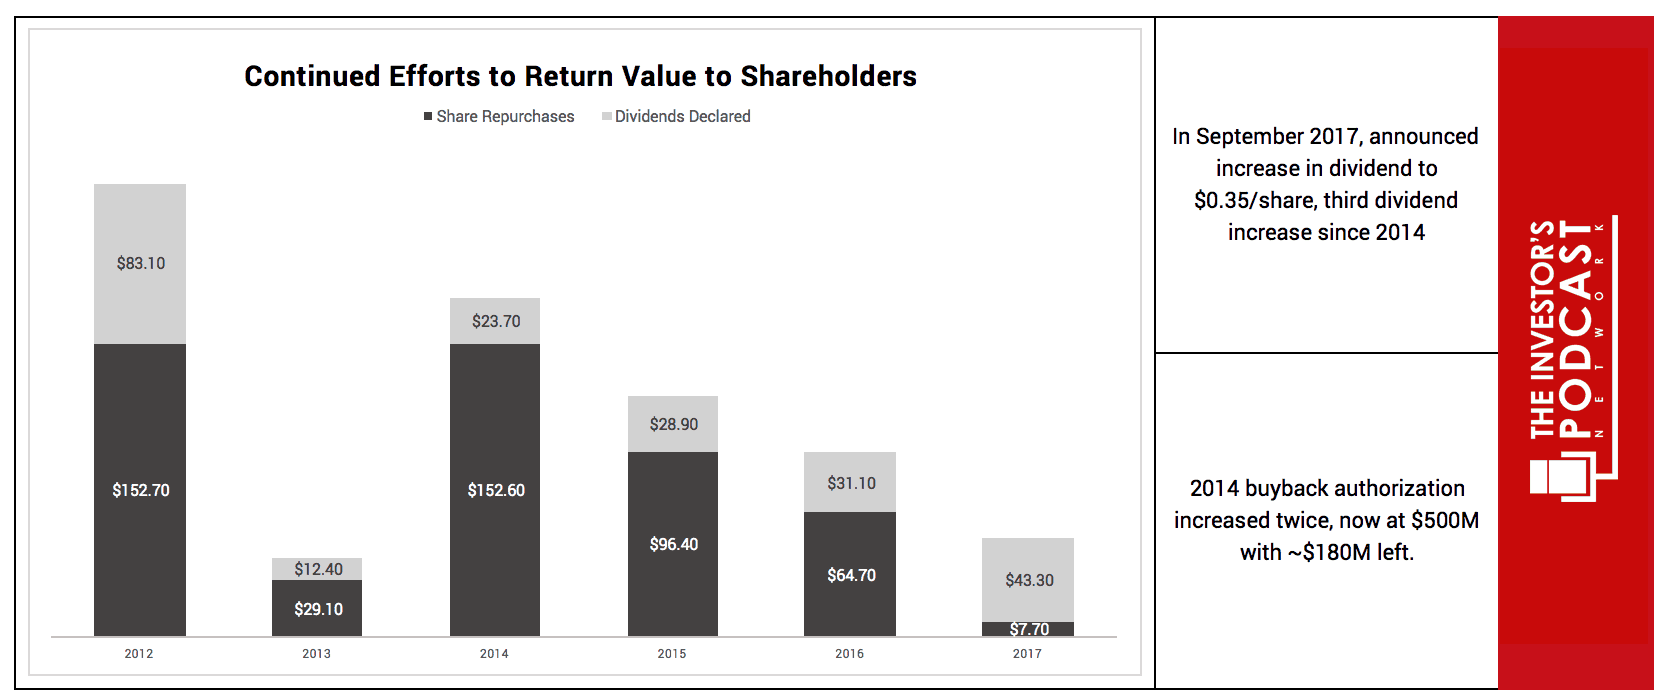
With regards to shareholder-friendliness, InterDigital Inc. has been returning value to shareholders in the form of dividends and share repurchases while maintaining its R&D operations to ensure the development of new technologies.
In summary, InterDigital Inc. is facing some tailwinds including the emergence and proliferation of 5G, IOT (Internet of Things), and autonomous transport. The company is also set to benefit from U.S. tax reform with a lower domestic rate of 21%. The company also notes the following in the 2018 Presentation at Needham Growth Conference. “On a go-forward basis, we currently expect a significant portion of our income to qualify as Foreign Derived Intangible Income (FDII) which, under the Tax Act, would be subject to an even lower tax rate of 13.1%.”
Based on the conservative assumptions used in the free cash flow analysis, InterDigital Inc. may return around 11% at the current market price.
Discover other comprehensive Intrinsic Value Assessments like this on our FREE Intrinsic Value Index.
To learn more about intrinsic value, check out our comprehensive guide to calculating the intrinsic value of stocks.
Disclaimer: The author does not hold ownership in any of the companies mentioned at the time of writing this article.