Intrinsic Value Assessment Of L Brands Inc (LB)
By David J. Flood From The Investor’s Podcast Network | 24 January 2018
INTRODUCTION
L Brands Inc. is an American fashion retailer. Its principal business involves the sale of lingerie, personal care and beauty products, apparel, and accessories. The company operates over 3,000 specialty stores in the United States, Canada, the United Kingdom, and the Republic of China. At present, the firm has over 80,000 associates, and its brands are sold in more than 700 franchised locations worldwide. L Brands Inc. is currently a member of the Fortune 500 list with a market cap of $14 Billion. Its revenues and free cash flows for the previous financial year were around $12.6 Billion and $0.9 Billion respectively. The company’s common stock has fluctuated between a low of $35 and a high of $63 over the past 52 weeks and currently stands at around $52. Is L Brands Inc. undervalued at the current price?
THE INTRINSIC VALUE OF L BRANDS INC.
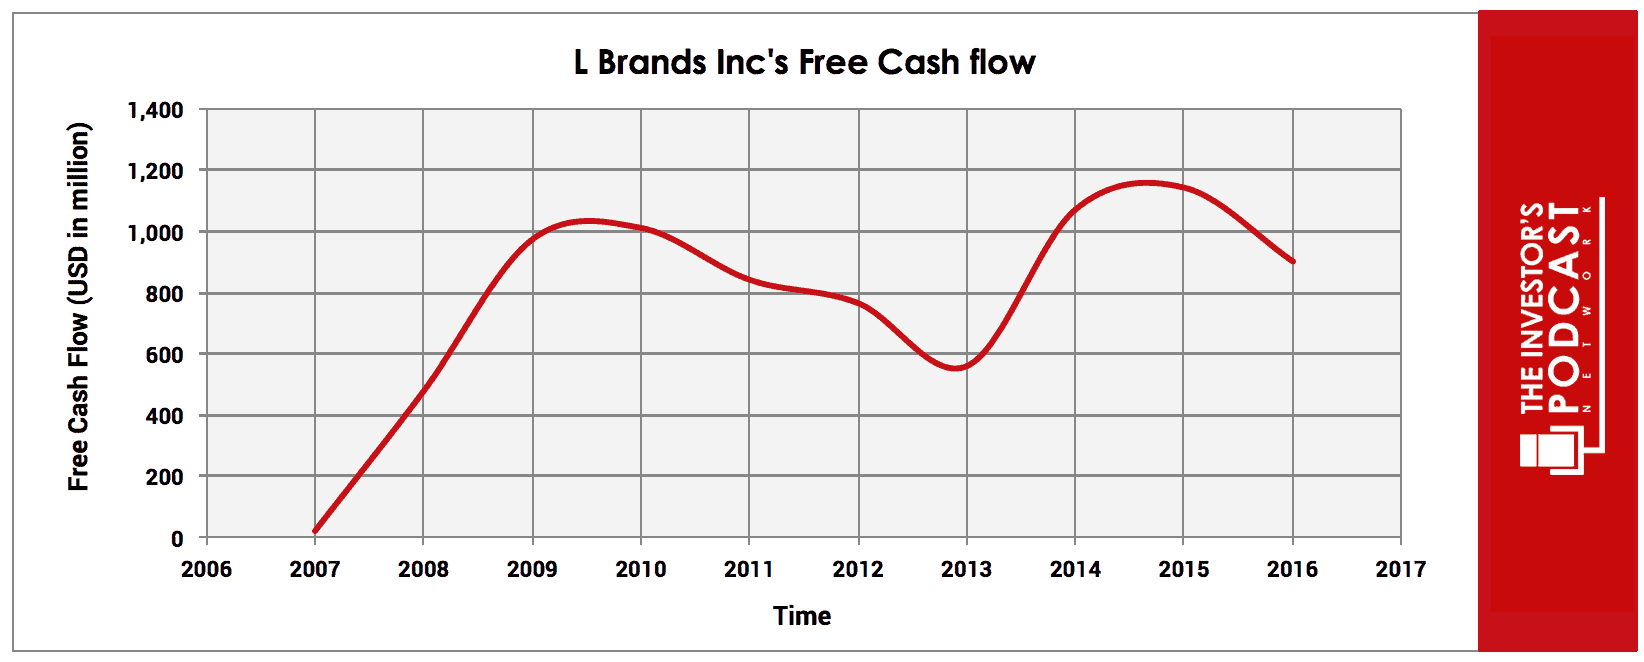
To determine the intrinsic value of L Brands Inc., we’ll begin by looking at the company’s history of free cash flow. A company’s free cash flow is the true earnings which management can either reinvest for growth or distribute back to shareholders in the form of dividends and share buybacks. Below is a chart of L Brands Inc.’s free cash flow for the past ten years.
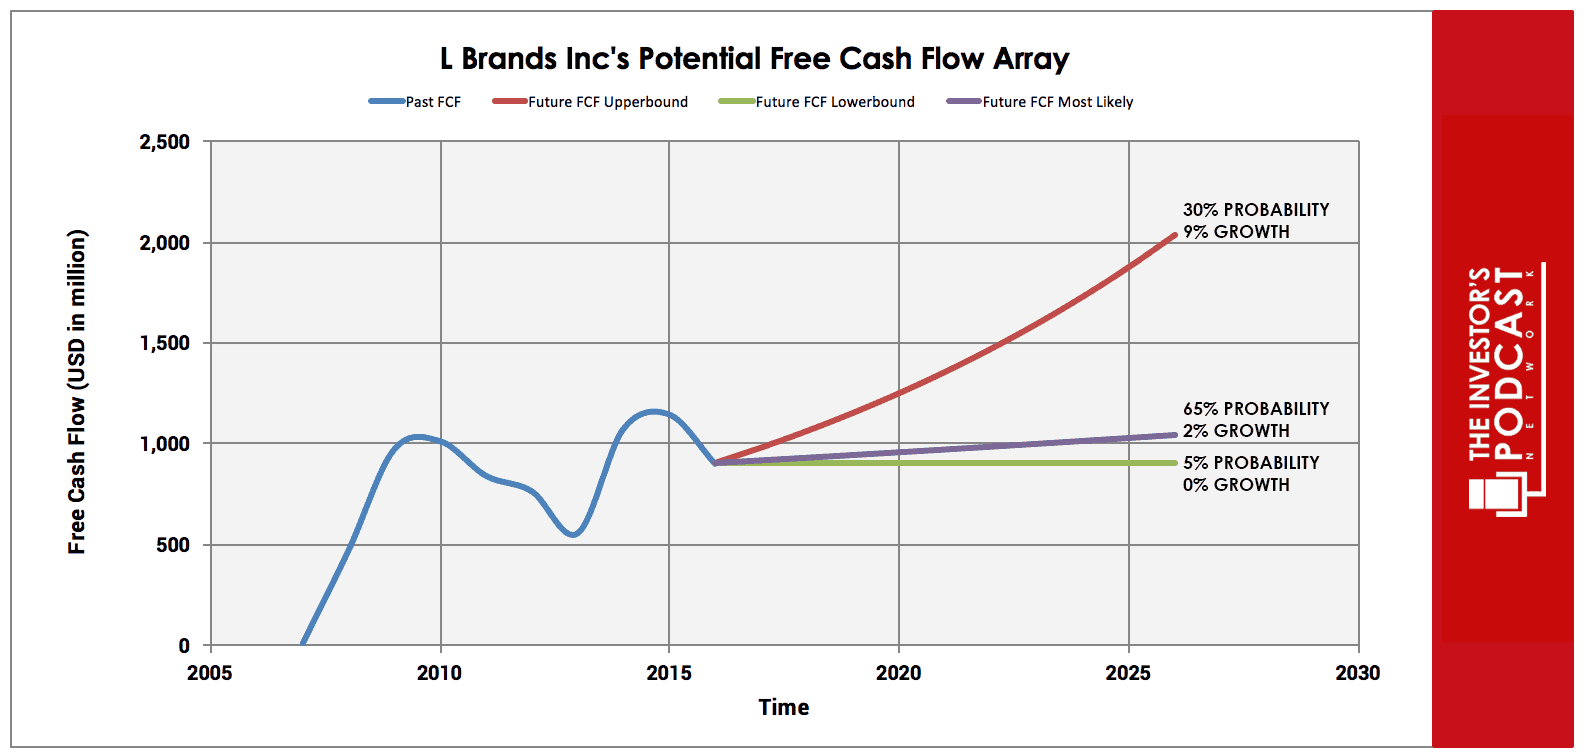
As one can see, the company’s free cash flow has been subject to the pressures associated with cyclical consumer companies and has fluctuated dramatically over the past ten years. To capture a more accurate picture of long-term free cash flow growth, the author has opted to use the annualized average growth rate in free cash flow between 2000-2017 which is 8.52%. To determine L Brands Inc.’s intrinsic value, an estimate must be made of its potential future free cash flows. To build this estimate, there is an array of potential outcomes for future free cash flows in the graph below.
When examining the array of lines moving into the future, each one represents a certain probability of occurrence. The upper-bound line represents an 8.52% growth rate which is based on the company’s historical rate of free cash flow growth referenced above. Since the company’s business is cyclical, the upper-bound rate has been assigned a 30% probability of occurrence to account for the possibility of an economic downturn within the next decade.
The middle growth line represents a 2% growth rate which is based on the company’s historical revenue growth rate. Revenues tend to be far more stable than earnings and offer a more realistic estimate of long-term future growth. For this reason, it has been assigned a 65% probability of occurrence.
The lower bound line represents a 0% growth rate in free cash flow growth and has been assigned a 5% probability of occurrence. This lower bound rate assumes that the company’s growth stagnates in the event of weakening economic growth.
Assuming these potential outcomes and corresponding cash flows are accurately represented, L Brands Inc. might be priced at a 6.6% annualized return if the company can be purchased at today’s price. We’ll now look at another valuation metric to see if it corresponds to this estimate.
Based on L Brands Inc.’s current Earnings yield, which is the inverse of its EV/EBIT ratio, the company is projected to return 9.31%. This is in line with the firm’s 10-year historical median average of 9%, suggesting that the company is fairly valued relative to its historical average. Finally, we’ll look at L Brands Inc.’s P/S ratio to see how it fairs relative to its historical average. At present, the company trades at a P/S of x 1.16 vs. its 10-year historical median average of 1.26 suggesting the firm is marginally undervalued.
Taking all these points into consideration, it seems reasonable to assume that L Brands Inc. is trading at a marginal discount to fair value at present. Furthermore, the company may return around 6-7% at the current price if the estimated free cash flows are achieved. Now, let’s discuss how and why these free cash flows could be realized.
THE COMPETITIVE ADVANTAGE OF L BRANDS INC.
L Brands Inc. has various competitive advantages outlined below.
- Brand value. L Brands Inc. possesses a number of valuable brands including Victoria’s Secret, Henri Bendel, La Senza, and Without a doubt, the company’s most valuable brand is Victoria’s Secret which has a global brand value of $3.9 Billion. This brand accounted for 62% of revenues in 2017 with 25% of US citizens with a household income of $100,000 shopping at Victoria’s Secret outlets. This strong brand presence allows the firm to outperform its peers on a number of key performance metrics which can be seen in the table below.
- Niche Attribute. L Brands Inc. positions itself in the premium niche of the fashion retail market. While this somewhat narrows its market, it allows the company to charge higher prices and thus achieve higher margins and returns than its peers. This element of prestige has allowed the company to maintain gross margins of around 40% for the last several years even while the retail sector has been undergoing massive upheaval with increasingly fierce competition emerging.
- Unique Supply Chain. L Brands Inc. has developed a dual supply chain for its Victoria’s Secret brand. In order to limit risk and ensure sufficient sales, it offers two different ranges. One is a high margin fashion range which is less predictable, and the other is a basic range which is a lower margin but more predictable. The supply chain for Victoria’s Secret’s fashion items utilizes a “Speed-to-Market” model to guarantee responsiveness. This supply chain uses a sourcing strategy that requires a group of suppliers with a first-rate record of product innovation, value-adding capabilities, and no minimum volume requirements. For this category of products, speed to market is prioritized over low costs of labor. The basic range supply chain is driven by efficiency and asset utilization to maintain low-cost production and supply. Vertically integrated factories are used to ensure productivity and capacity utilization is maximized.
L BRANDS INC.’S RISKS
Now that L Brands Inc.’s competitive advantages have been considered, let’s look at some of the risk factors which could impair my assumptions of investment return.
- While L Brands Inc. does possess multiple competitive advantages, there still exists a possibility that one of its rivals or a new entrant could mount a challenge to erode its competitive advantages and move on its market share. It should be noted that there are rumors that Amazon may be intending to begin selling premium lingerie which could weaken L Brands Inc.’s moat.
- L Brands Inc.’s operating results depend in part on maintaining a strong brand and developing appealing products. Failure to maintain their brand and track record of product development would likely see the firm’s economic performance decline.
- The emergence of a serious economic crisis similar to that witnessed in 2008 could materially impact the company’s revenues and profits leading to lower growth in the coming years. While L Brands Inc. possesses numerous competitive advantages, a major decline in global economic growth would be detrimental to the company’s economic performance given the cyclical nature of the consumer market in which it operates.
OPPORTUNITY COSTS
Whenever an investment is considered, one must compare it to any alternatives to weigh up the opportunity cost. At present, 10-year treasuries are yielding 2.56%. If we take inflation into account, the real return is likely to be closer to 1%. The S&P 500 Index is currently trading at a Shiller P/E of 33.7x, 100.6% higher than the historical mean of 16.8x. This gives the S&P 500 an implied future annual return of -3.4%, assuming reversion to the mean occurs. While L Brands Inc. appears to offer a higher rate of return than both U.S. Treasuries and the S&P 500, other individual stocks may be found which may offer a more favorable return relative to the risk profile.
MACRO FACTORS
Investors must consider macroeconomic factors that may impact economic and market performance as this could influence investment returns. At present, the S&P is priced at a Shiller P/E of 33.7x. This is 100.6% higher than the historical mean average of 16.8x suggesting markets are at elevated levels. U.S. unemployment figures are at a 30-year low suggesting that the current business cycle is nearing its peak. U.S. private debt/GDP currently stands at 199.6% and is at its highest point since 2009 when the last financial crisis prompted private sector deleveraging.
SUMMARY
The future for L Brands Inc. looks uncertain at present. The company is not only under pressure from competitors such as The Gap, American Eagle Outfitters, and Hanes, but Amazon may well emerge as a direct competitor if the recent rumors come to fruition. The risk of an economic downturn is also a growing concern given the historically high levels of debt present in the global economy. L Brands Inc.’s business is cyclical in nature and would suffer in a recessionary environment. On the plus side, the market appears to be overlooking a significant amount of hidden value within the company. On first glance, the firm appears to be trading at negative equity with total liabilities of $8,899 Million vs. Total assets of $8170 Million. A closer look at the company’s balance sheet reveals something interesting. The company is currently valuing its Net Trade Names and Other Intangible Assets at $411 Million. This is a significant undervaluation of the company’s brands relative to the kind of figure brand consultancy firms are placing upon it. Brand Finance, a London-based valuation and strategy agency, currently values Victoria’s Secret brand at $3.9 Billion. Thus, the market is significantly mispricing the intangibles assets of L Brands Inc.
At present, L Brands Inc. appears marginally undervalued on a cash flow basis with an estimated return of around 6-7%. However, keep in mind that on an assets basis, the company appears significantly mispriced by the market and wide-scale recognition of this will likely see the share price move up significantly.
To learn more about intrinsic value, check out our comprehensive guide to calculating the intrinsic value of stocks.


