Skip to content
 Intrinsic Value Assessment Of McKesson Corp (MCK)
By David J. Flood From The Investor’s Podcast Network | 18 October 2017
INTRODUCTION
McKesson Corp. is an American Healthcare company whose operations are divided into two segments, namely McKesson Distribution Solutions and McKesson Technology Solutions. Its lines of business involve the distribution of pharmaceuticals at the retail level. It also provides medical supplies, health information technology, and care management products. McKesson Corp. is currently ranked fifth on the Fortune 500 list with a market cap of $30.9 billion. Its revenues and free cash flows for the previous financial year were around $198.5 billion and $4.2 billion respectively. The company’s common stock has fluctuated between a low of $115 and a high of $169 over the past 52 weeks and currently stands at $147. Is McKesson Corp. undervalued at the current price?

THE INTRINSIC VALUE OF MCKESSON CORP.
To determine the intrinsic value of McKesson Corp., we’ll begin by looking at the company’s history of free cash flow. A company’s free cash flow is the true earnings which management can either reinvest for growth or distribute back to shareholders in the form of dividends and share buybacks. Below is a chart of McKesson Corp.’s free cash flow for the past ten years. An adjustment has been made to account for a one-time gain of $1.26 billion in FY 2017.
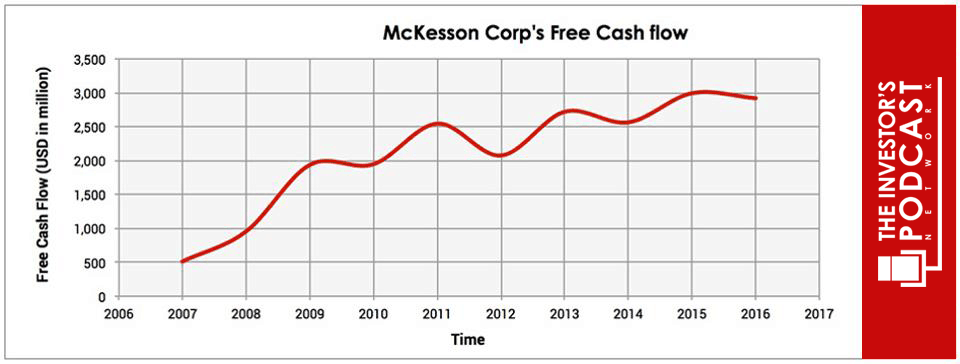
As one can see, the company has generated strong growth in free cash flow over the past decade with an annualized growth rate in free cash flows of around 21%. To determine McKesson Corp’s intrinsic value, an estimate must be made of its potential future free cash flows. To build this estimate, there is an array of potential outcomes for future free cash flows in the graph below.
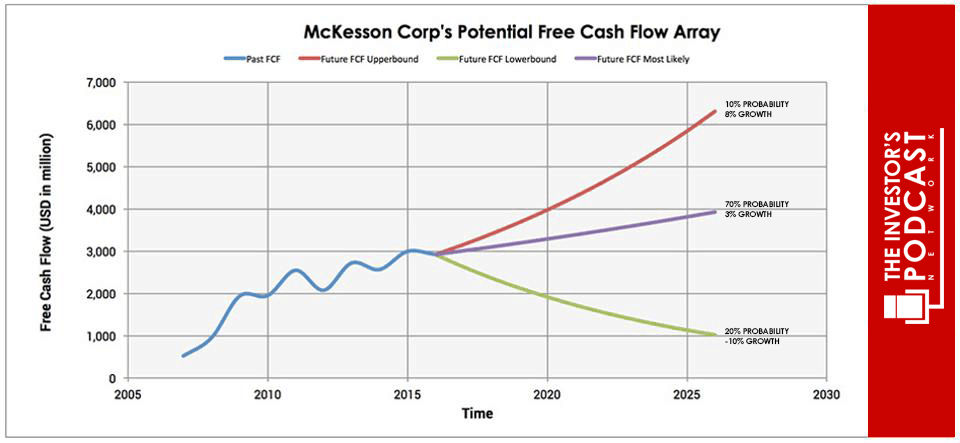
When examining the array of lines moving into the future, each one represents a certain probability of occurrence. The upper-bound line represents an 8% growth rate, and I’ve estimated there is a 10% probability of occurrence. The reason such a low level of confidence has been placed in this upper growth rate are numerous. Excess profits attract competition which seeks to erode a company’s competitive advantages and move on its market share, a company inevitably reaches saturation point within its markets limiting potential for future growth, a company’s size and scale may become a weakness if it is less capable of adapting to changing market conditions, and misallocation of capital may occur as management engages in what Peter Lynch termed “diworsification,” essentially a misguided attempt to diversify operations to fuel growth.
The middle growth line represents a 3% growth rate. This is based on McKesson Corp.’s historical revenue growth rate which is a much more stable and conservative estimate. For this reason, it has been assigned a 70% probability of occurrence. The lower bound line represents a -10% contraction in free cash flow growth and has been assigned a 20% probability of occurrence. This lower bound rate assumes that the company’s future free cash flow growth is impacted by competitive pressure and a decrease in growth opportunities. Assuming these potential outcomes and corresponding cash flows are accurately represented, McKesson Corp. might be priced at a 9% annual return if the company can be purchased at today’s price. We’ll now look at another valuation metric to see if it corresponds with this estimate.
Based on McKesson Corp.’s current earnings yield, which is the inverse of its EV/EBIT ratio, the company is projected to return around 18%. This is 10% higher than the upper bound estimate. Now, we’ll look at how this compares to both the global industrial average and the company’s historical average earnings yield to see how it corresponds. Using a 13-year median average as our benchmark, the company’s historical earnings yield comes out at 8.80%, and the current global industrial median average is 5.56%. Taking all these points into consideration, it seems reasonable to assume that McKesson Corp. is undervalued relative to its peers and the market’s historical valuation for the company. Now, let’s discuss how and why these estimated free cash flows could be achieved.

THE COMPETITIVE ADVANTAGE OF MCKESSON CORP.
McKesson Corp. has various competitive advantages outlined below:
- Oligopoly Power. McKesson Corp. (MCK), along with its two closest competitors, Cardinal Healthcare Inc. (CAH) and AmerisourceBergen Corp. (ABC), forms an oligopoly which collectively controls over 90% of the U.S. pharmaceuticals distribution market. Mckesson Corp. accounts for the delivery of 1/3 of all prescription medicine in North America.
- Efficiencies of Scale. McKesson Corp. derives efficiencies of scale through its huge distribution network. Indeed, the company is the largest drug wholesaler by revenues and operates 31 distribution centers, a master distribution center, and other facilities. Additionally, MCK has extensive Canadian operations with another 14 distribution centers. This scale of operations has enabled the company to achieve a 99.98% order accuracy across North America distribution and services and a 99.90% inventory accuracy across International distribution and services. McKesson Corp.’s huge distribution network also creates a barrier to entry as the huge costs in the capital, time and energy to replicate this infrastructure are simply too great.
- Intangible Assets. McKesson Corp. owns a large portfolio of patents including 48 U.S. protected patents, these intangible assets are extremely valuable as they create barriers to entry preventing competitors from mounting a challenge with competing products.
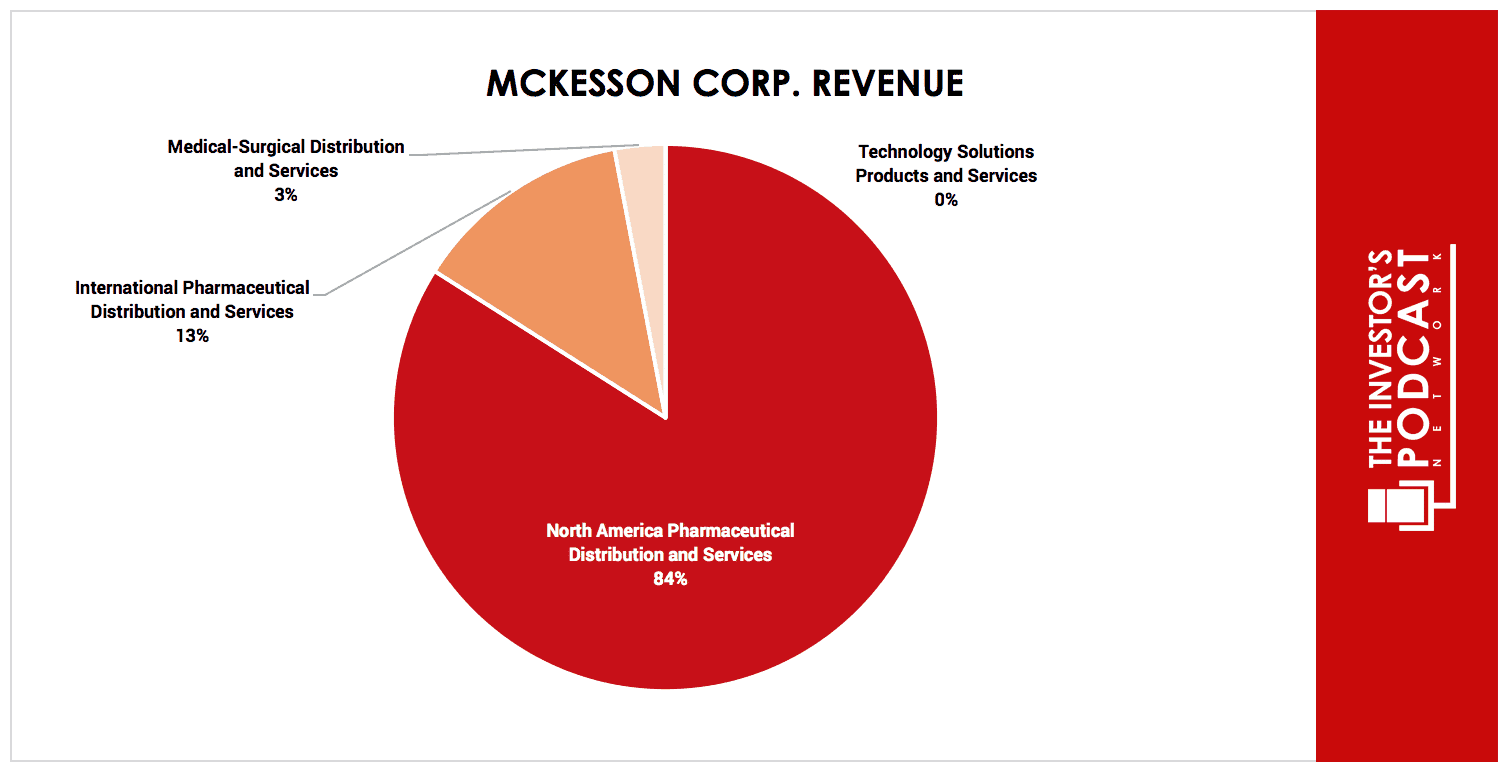
- Economies of scale. As mentioned earlier McKesson Corp. is one of the big three in the pharmaceuticals distribution oligopoly and eclipses its rivals in terms of revenue; it currently generates 1.5 times the revenue of its closest rival Cardinal Health Inc. The chart below shows a breakdown of these revenues for the most recent quarter.
Thanks to its dominance over the market, McKesson Corp. is able to outperform its rivals on some performance metrics. The chart below compares the big three.

As one can see, McKesson Corp. has outperformed its rivals on every metric and demonstrates the power of its competitive advantages.
MCKESSON CORP.’S RISKS
Now that McKesson Corp.’s competitive advantages have been considered, let’s look at some of the risk factors that could impair those assumptions of investment return.
- Unfavorable government intervention could prompt anti-trust action which seeks to break the dominance McKesson Corp. currently holds over its market. Further, changes within the healthcare industry could lead to cuts in Medicare and Medicaid reimbursement levels which impact the company’s revenues and earnings.
- Price inflation from suppliers could squeeze margins and thus reduce revenues and earnings. These may impact McKesson Corp.’s diverse range of products & services more than some of its competitors whose operations are narrower in scope.
- Generic drug manufacturers may increasingly challenge the validity and enforceability of McKesson Corp.’s patents on branded pharmaceutical products which leads to increased competition and loss of market share.
- McKesson Corp. may not be able to secure such favorable distribution business agreements with its suppliers as it has in the past or it may suffer the loss of a major customer.
OPPORTUNITY COSTS
Whenever an investment is considered, one must compare it to any alternatives to weigh up the opportunity cost. At present, 10-year treasuries are yielding 2.16%. If we take inflation into account, the real return is likely to be closer to 1%. The S&P 500 Index is currently trading at a Shiller P/E of x 30, meaning it is priced for an earnings yield of 3.3%. McKesson Corp., therefore, appears to offer a much better return for investors at present but other individual stocks may be found which offer a similar return relative to the risk profile.
MACRO FACTORS
Investors must consider macroeconomic factors that may impact economic and market performance as this could influence investment returns. At present, the S&P is priced at a Shiller P/E of 30. This is over 85% higher than the historical average of 16.8, suggesting markets are at elevated levels. U.S. unemployment figures are at a 30-year low suggesting that the current business cycle is nearing its peak. U.S. private debt/GDP currently stands at 199.6% and is at its highest point since 2009 when the last financial crisis prompted private sector deleveraging.
SUMMARY
The future for McKesson Corp. looks favorable if it can maintain its dominant position with the U.S. pharmaceutical distribution oligopoly that currently exists. Pharmaceutical spending within North America is projected to grow at approximately 6-9% CAGR between 2016-2021 and Global pharmaceutical spending for the same period is projected to grow at approximately 4-7% CAGR. McKesson Corp. also has much runway ahead of it in terms of growth opportunities in Canada, the UK, and other international markets. Investors purchasing the company at the current price may earn a 9% return on investment benefit and reap value through the company’s continued share repurchase program and distributions of dividends. This estimate is very conservative compared to revenue growth projects found elsewhere.
To learn more about intrinsic value, check out our comprehensive guide to calculating the intrinsic value of stocks.