Understand the financial markets
in just a few minutes.
Get the daily email that makes understanding the financial markets
easy and enjoyable, for free.
Stock Market Bottom: Is It In, or More Losses Ahead?
By Rebecca Hotsko • Published: • 6 min read
Despite markets eagerly awaiting a Fed pivot as a positive sign that this bear market is over, Lance Roberts explained that when the Fed pivots, this is not the time when you want to go all in on buying stocks. Rather, it’s when you want to be out of them. So, what does that mean for the market? Is there a stock market bottom ahead, or are we there now?
WHAT IS A STOCK MARKET BOTTOM?
A stock market bottom is a term used to describe the point in time when the stock market reaches its lowest level during a major correction in the market or a “bear market”. At this point, investor sentiment is typically very negative, and there is a widespread sense of pessimism and fear. A stock market bottom is followed by a period of recovery as investor confidence begins to return and buying activity increases.
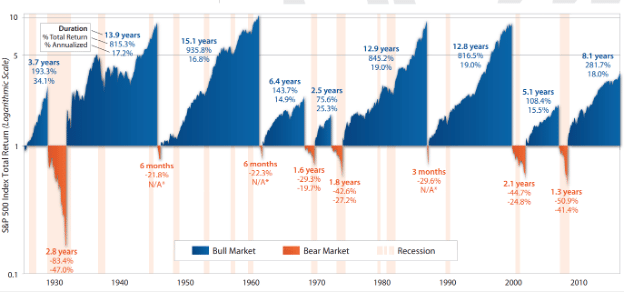
As an example, since the S&P 500’s inception in 1926 it has experienced 10 stock market bottoms as of the end of 2022. On average, these bear markets have lasted 1.4 years with an average total cumulative loss of -41%.
On the contrary, the largest gains typically follow after these market bottoms as a new bull run begins. Since 1926, the average bull market has lasted 8.9 years and has posted an average cumulative return of 468%.
LANCE ROBERTS ON A POTENTIAL STOCK MARKET BOTTOM
Why did Lance Roberts say, “that when the Fed pivots, this is not the time when you want to go all in on buying stocks. Rather, it’s when you want to be out of them,”?
Historically, a stock market bottom happens later in the Fed easing cycle, not at the beginning of it.
History shows that a stock market bottom usually happens when the yield curve has un-inverted and turns positive (as measured by the spread between the 2-year and 10-year bonds), around 140 bps.
Currently, the yield curve is still deeply inverted to the highest levels in 40 years, around -60 bps.
There are two ways the yield curve can turn positive:
- The short end of the curve (the 2-year yield) declines
- The 10-year yield increases
Remember, the Fed only controls the short end of the curve. In contrast, the long end of the curve, being the 10-year, 20-year, and 30-year, is influenced primarily by inflation, economic activity, and wages.
The Fed is trying to bring down the long end of the curve by slowing economic activity and consequently reducing inflation expectations. But if they do this, the yield curve will become more negatively inverted.
However, if something ‘breaks’ in the economy before they can achieve this, then they may be forced to cut rates, thereby reducing the short end of the curve.
Historically, the yield curve has un-inverted because the Fed aggressively cuts rates, and the short end of the curve falls much faster than the long end.
Understand the financial markets
in just a few minutes.
Get the daily email that makes understanding the financial markets
easy and enjoyable, for free.
HAS THE STOCK MARKET BOTTOMED OUT?
Similarly, earnings usually don’t hit their lows until the yield curve spread returns to positive territory.
Earnings come from economic activity. If economic activity is projected to slow, corporate earnings must also be revised down. Right now, earnings are expected to grow at about 5% for 2023, far from pricing in a recession.
Moreover, because interest rates take several quarters to work through the economy and the Fed began their hiking in March of 2022, it’s estimated that only 25 bps worth has been felt in the economy so far.
Still Pain to Come
This means that there are still 4% of rate hikes that the real economy has not felt yet that still need to flow through.
With nearly all of the rate hikes of 2022 yet to hit the real economy while the Fed continues hiking to get inflation under control, it doesn’t seem reasonable to assume that this would be a scenario where corporate profits could grow in aggregate by 5%. Profit margins are already at record highs, which is hard to sustain, and even harder as wages rise while demand is expected to slow.
Moreover, an estimated 1 trillion in corporate debt is due in 2023. In the best-case scenario, this will be very expensive for companies rolling over their debt, and in the worst-case scenario, it will cause defaults to rise.
Because of the lag effect from when the Fed hikes rates to when it’s actually felt in the economy, we typically don’t see a stock market bottom until we are already in a recession.
But the catch is that we also won’t know we are in a recession until after the fact, as economic data is released with a lag.
All of this being mentioned, profit margins, stock prices, etc., are all a natural part of the mean reversion process we’ve written about at length.
What the Stock Market Currently has Priced in for 2023
Markets are pricing in the Fed funds rate to get up to 5% and then start easing by about 50 bps in the second half of the year, whereas the 10-year treasury is currently around 3.60%, and the yield curve is inverted across almost the entire spectrum.
WHEN WILL THE STOCK MARKET BOTTOM OUT?
While it’s impossible to know if and when we will enter a recession, what we do know is that all indicators are pointing to one, or at least a major slowdown in economic activity. Given that 2022 was the year of the Fed hiking rates, 2023 will be the year these rate hikes are felt in the economy.
Because there has never been an economic recession without an earnings recession, earnings are likely overstated for 2023 and will need to be revised down.
Similarly, while it’s impossible to predict a stock market bottom, historically, it happens later in the Fed’s easing cycle and when the yield curve has un-inverted and is back in positive territory.
Understand the financial markets
in just a few minutes.
Get the daily email that makes understanding the financial markets
easy and enjoyable, for free.
About The Author

Rebecca Hotsko
Rebecca Hotsko is an investor and entrepreneur based in Canada. Most recently, she co-founded a luxury boat sharing club in Kelowna B.C. Rebecca graduated from the University of Saskatchewan with a bachelor’s degree in Economics and since has completed CFA level I and II. In prior years, Rebecca gained valuable experience working as an analyst for the Bank of Canada, the federal energy regulator and in investment management. Her passion for teaching others how to invest using time-tested strategies backed by empirical data also led her to create an investing blog in 2020.
