Skip to content
 Intrinsic Value Assessment Of Dick’s Sporting Goods Inc. (DKS)
By David J. Flood From The Investor’s Podcast Network | 30 April 2018
INTRODUCTION
Dick’s Sporting Goods Inc. is an American based omnichannel sports goods retailer whose operations involve the sale of sports equipment, apparel, footwear, and accessories. The firm’s market cap currently stands at around $3.31 Billion and its revenues and free cash flows for the previous financial year were around $8.6 Billion and $0.27 Billion respectively. The company’s common stock has fluctuated between a high of $52 and a low of $24 over the past 52 weeks and currently stands at around $34. Is Dick’s undervalued at the current price?
THE INTRINSIC VALUE OF DICK’S SPORTING GOODS, INC.
To determine the intrinsic value of Dick’s, we’ll begin by looking at the company’s history of free cash flow. A company’s free cash flow is the true earnings which management can either reinvest for growth or distribute back to shareholders in the form of dividends and share buybacks. Below is a chart of Dick’s free cash flow for the past ten years.
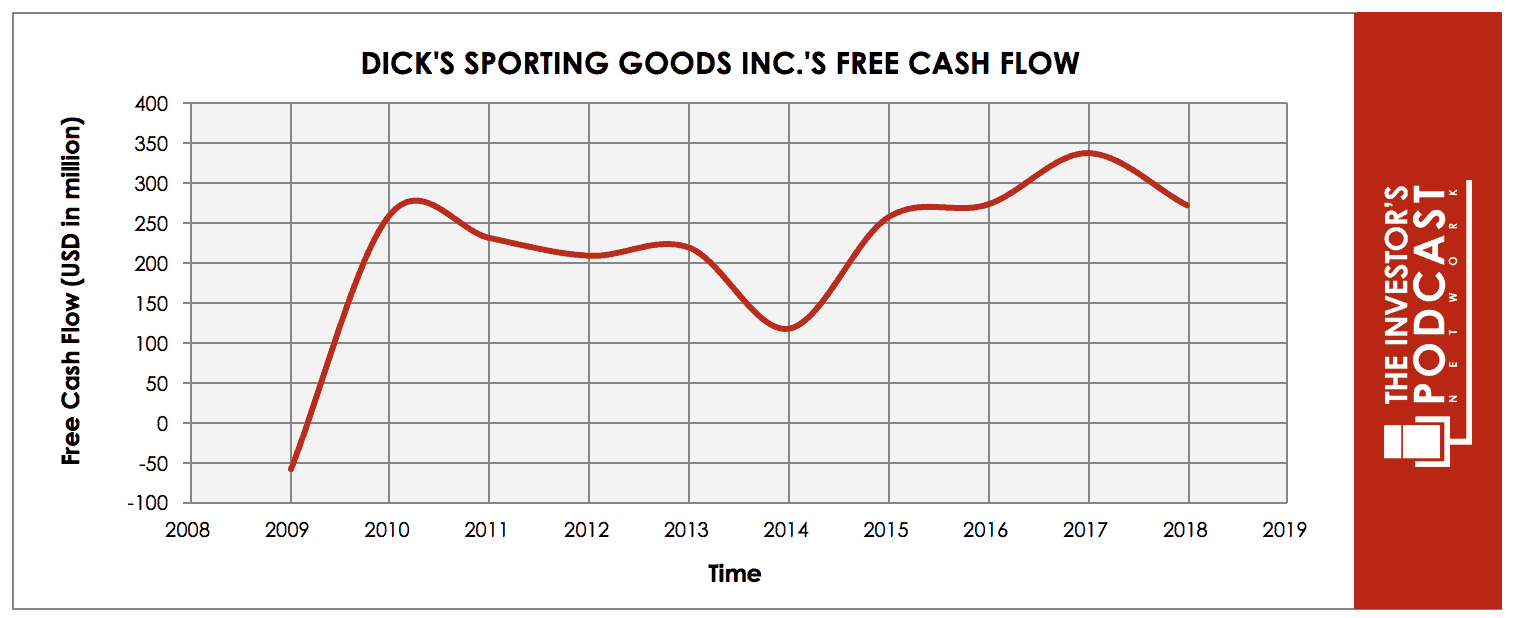
As one can see, the company’s free cash flow has been lumpy over the past decade which is a common feature for cyclical companies whose business is tied to the fluctuations present in the business cycle. To determine Dick’s intrinsic value, an estimate must be made of its potential future free cash flows. To build this estimate, there is an array of potential outcomes for future free cash flows in the graph below.
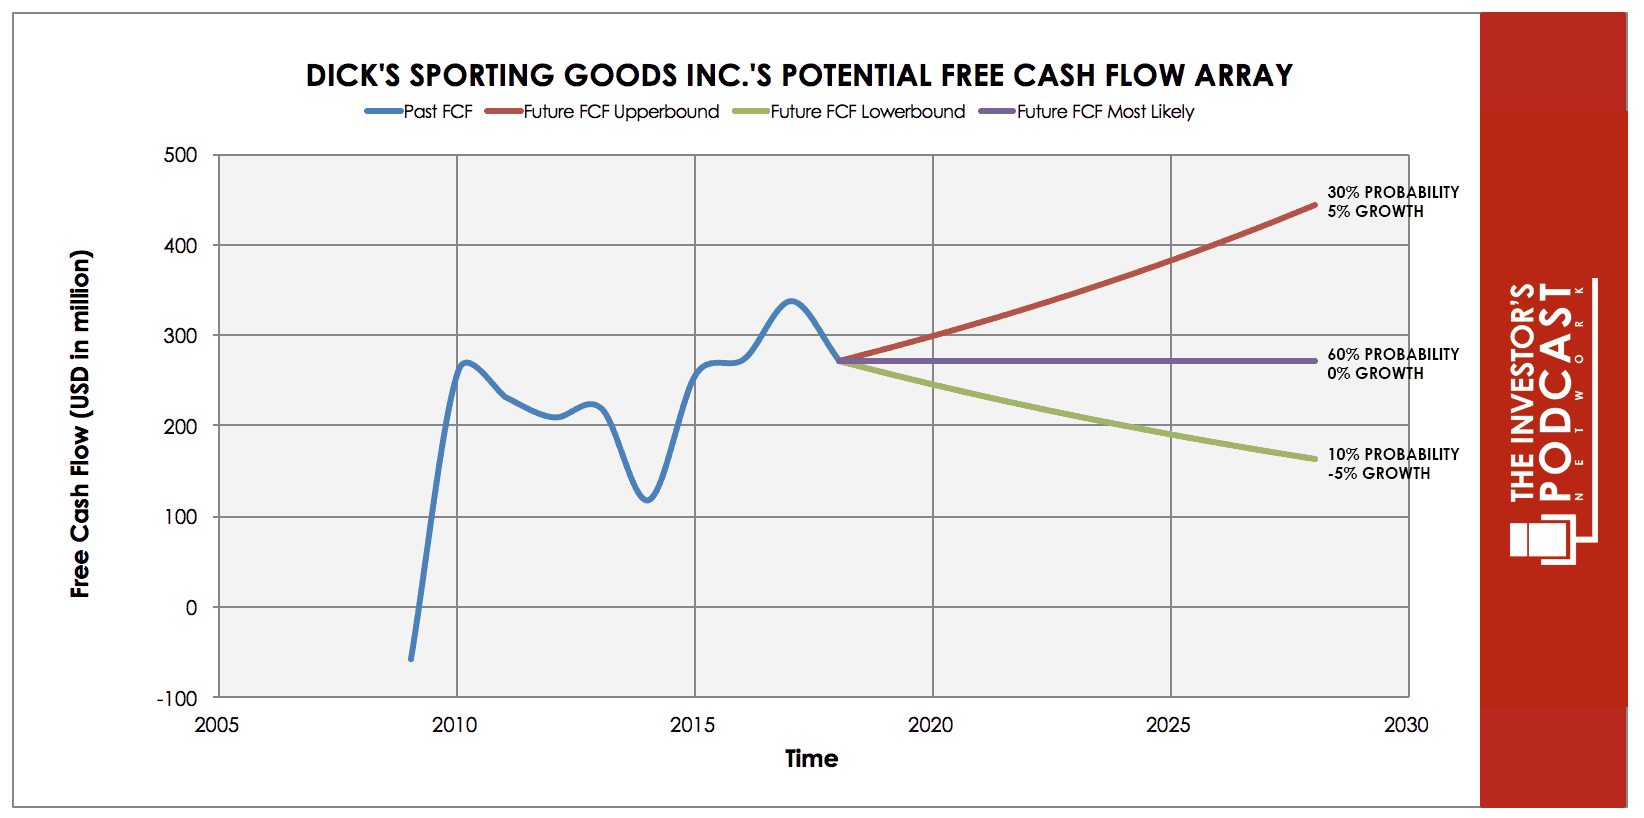
When examining the array of lines moving into the future, each one represents a certain probability of occurrence. The upper-bound line represents a 5% growth rate which is based on the market’s current expectations for the company is the next five years. This growth rate has been assigned a 30% probability of occurrence to account for the threat of competitive pressure from the firm’s peers and the increasing likelihood of a recessionary environment emerging in the next ten years.
The middle growth line represents a 0% growth rate which is based on the firm’s historical free cash flow growth for the previous ten years. Given the competitive pressure Dick’s is facing and signs of weakening consumer demand, this scenario been assigned a 60% probability of occurrence.
The lower bound line represents a -5% rate in free cash flow growth and assumes that consumer demand further weakens and that competitive pressures continue to mount. This growth rate has been assigned a 10% probability of occurrence.
Assuming these potential outcomes and corresponding cash flows are accurately represented, Dick’s might be priced close to a 7% annual return if the company can be purchased at today’s price. We’ll now look at another valuation metric to see if it corresponds to this estimate.
Based on Dick’s current ‘forward rate of return,’ a metric which uses normalized free cash flow plus real growth and inflation, the company is currently yielding 13.91%. This is in line with the firm’s 10-year historical median of 13.90%, suggesting that the company may be trading at a fair value relative to its historical comparison. Finally, we’ll look at Dick’s normalized free cash flow yield, a metric which assumes zero growth and simply measures the firm’s average free cash flow for the last ten years against its current market price. At the current market price, Dick’s has a normalized free cash flow of 5.92%.
Taking all these points into consideration, it seems reasonable to assume that Dick’s is currently trading around fair value. Furthermore, the company may return around 7% at the current price if the estimated free cash flows are achieved. Now, let’s discuss how and why these estimated free cash flows could be achieved.

THE COMPETITIVE ADVANTAGE OF DICK’S SPORTING GOODS, INC.
Dick’s Sporting Goods Inc. has various competitive advantages outlined below.
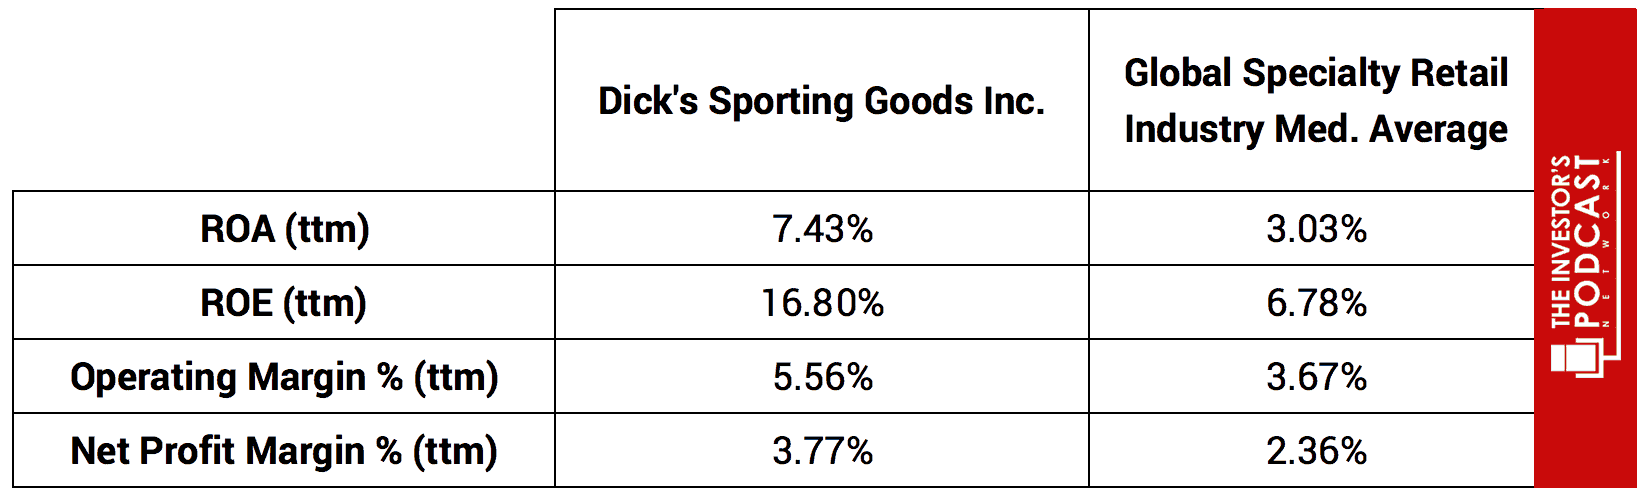
- Niche Attribute. Dick’s differentiates itself from many of its competitors by opting to stock higher-end specialty products and merchandise which typically carry higher margins than mid and low-tier products. This allows the company to outperform the industry on several key metrics outlined in the table below.
- Omni-channel Model. Dick’s has grown to become the largest omnichannel full-line sports retailer in the U.S. By employing this model, the firm is better equipped to reach its target customers and effectively market its products. Over the past year, the firm has moved its e-commerce business in-house with online sales growing 16% YOY and now accounting for over 10% of net sales. By combining the firm’s established bricks-and-mortar business with its e-commerce platform and intangible assets such as its database, Dick’s possesses the competitive advantages necessary to grow its market share.
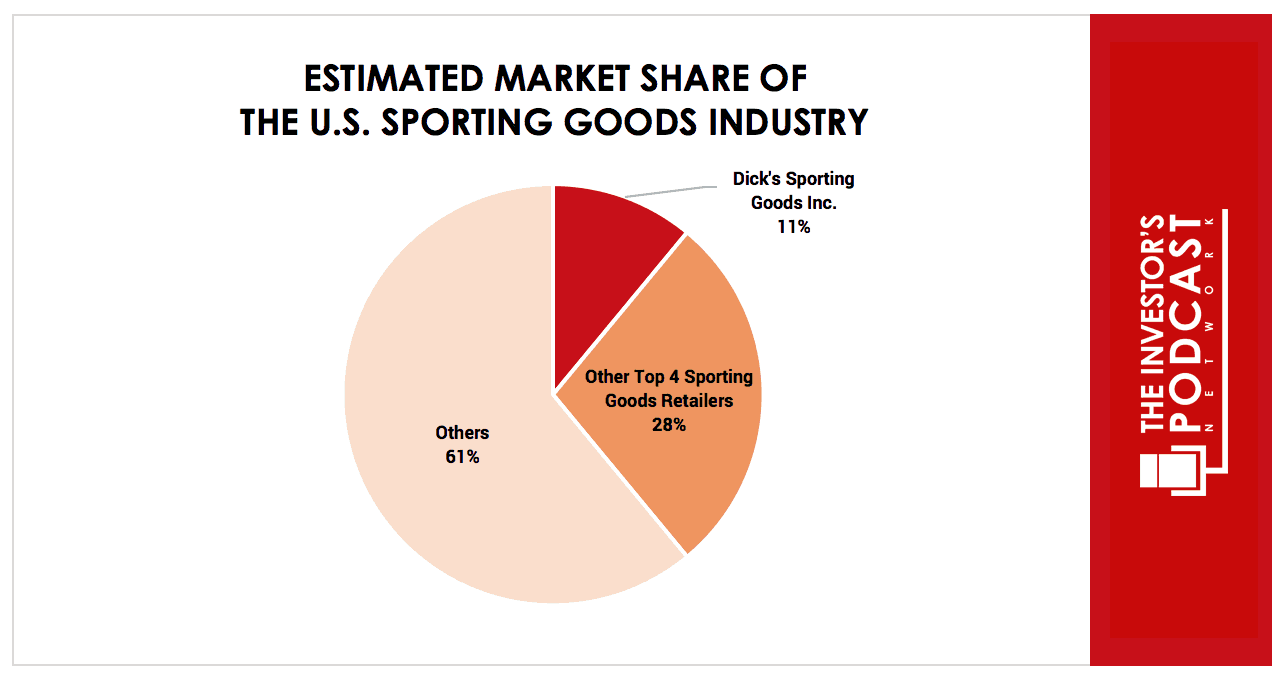
Figure 1: Source, Dick’s Website
- Intangible Assets. Through strategic acquisitions, Dick’s has built up a database containing data on the sports participation of several million individuals across the youth demographic. These acquisitions include the registration company, Blue Sombrero, the governing body support system Affinity, and Gamechanger (a leading consumer app which logs scoring and statistics). By partnering with numerous sports governing bodies, Dick’s continues to build this database which allows it to tailor its marketing in an increasingly effective manner. This is a powerful competitive advantage for Dick’s as neither Amazon nor Target possesses such a rich database of information.
DICK’S SPORTING GOODS INC.’S RISKS
Now that Dick’s competitive advantages have been considered, let’s look at some of the risk factors that could impair my assumptions of investment return.
- Dick’s is currently facing increasing competitive pressure as companies such as Nike, Adidas, and Under Armour are opting to move to Amazon or to sell their products directly to the consumer through their own stores and websites. At present, Dick’s largest two vendors, Nike and Under Armour, account for about 20% and 10% of merchandise sales respectively. With Nike and Adidas aiming to achieve 30% and 40% respectively regarding direct-to-consumer sales as a proportion of revenue growth by 2020, Dick’s may face the risk of obsolescence if it cannot adapt to these changes.
- A key driver for Dick’s business is youth participation in sports, but the current trends do not appear to be moving in the company’s favor. A recent study by the Aspen Institute shows a decline in regular participation in both individual and team sports for children between the ages of 6 and 12 in the United States.
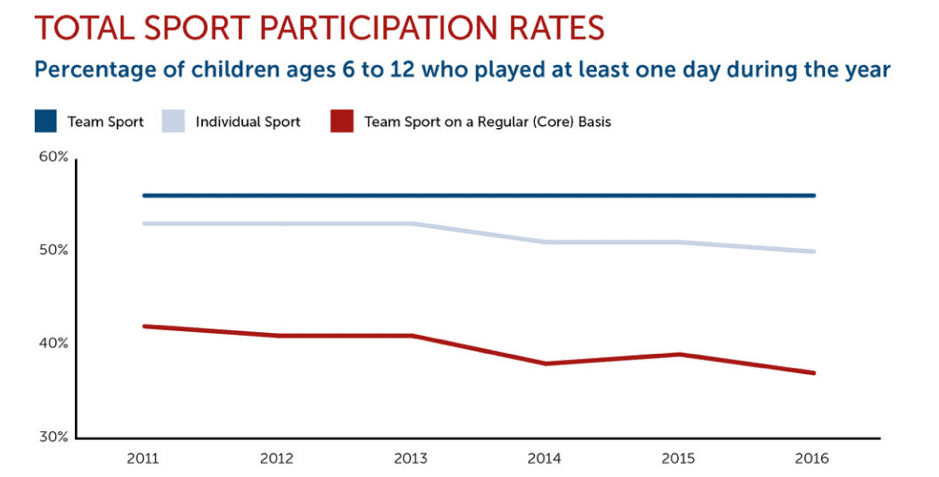
Figure 2: Source, aspenprojectplay.
- Dick’s has recently launched a price matching program with many of its competitors including Amazon, Target, Foot Locker, and Kohl’s. The company has stated that it will match any qualifying retailer’s in-store or online price on identical items with customers given the option of where they want to price match, be it online or in store. The implementation of price matching and the associated discounting of products is a risky approach for Dick’s as it relies on the company being able to make up for losses through weaker margins by gains made from incremental sales growth. There is no guarantee that this strategy will be successful, and it may impair perception of the firm’s brand as a specialty retailer.
OPPORTUNITY COSTS
Whenever an investment is considered, one must compare it to any alternatives to weigh up the opportunity cost. At present, 10-year treasuries are yielding 2.96%. If we take inflation into account, the real return is likely to be closer to 1%. The S&P 500 Index is currently trading at a Shiller P/E of 31.5 which is 86.4% higher than the historical mean of 16.8. Assuming reversion to the mean occurs, the implied future annual return is likely to be -2.5%. Dick’s, therefore, appears to offer a much better return for investors at present, but other individual stocks may be found which offer a similar return relative to the risk profile.
MACRO FACTORS
Investors must consider macroeconomic factors that may impact economic and market performance as this could influence investment returns.
At present, the S&P is priced at a Shiller P/E of 31.5. This is 86.4% higher than the historical average of 16.8 suggesting markets are at elevated levels. U.S. unemployment figures are at a 30-year low suggesting that the current business cycle is nearing its peak. U.S. private debt/GDP currently stands at 199.6% and is at its highest point since 2009 when the last financial crisis prompted private sector deleveraging.
SUMMARY
Dick’s Sporting Goods Inc. is currently facing a number of challenges which do not appear to be abating. It is facing competitive pressure from players such as Amazon and Wal-Mart whose low-cost model is forcing Dick’s to discount its products in an attempt to retain market share. Despite the firm’s price matching program, FY 2017 results show same-store sales declining by nearly 1%. Looking at the company’s performance over a longer period, margins have been on a downward trend since 2013 with a gross margin decline from 31.5% in 2013 to 29% in 2018, and an operating margin decline from 9% in 2013 to 5.6% in 2018.
The firm is also facing the problem of major brands choosing to sell their products direct to consumers via their own stores and websites. Dick’s is opting to focus more on its own private label brands in an attempt to offset this, but there is no guarantee that this will be a winning strategy.
Considering how Dick’s has performed in previous recessionary environments, investors should be under no illusion that the firm will not be adversely affected should an economic downturn materialize. The company is, however, in a strong financial position with a debt/equity ratio of 0.03 and an Altman Z-Score of 4.22 suggesting that the company is highly unlikely to be at risk of bankruptcy in the coming years.
There are, however, some factors which may work in favor of Dick’s. Over the past few years, a number of the firm’s competitors including Sports Authority, Vestis Retail Group, and Sport Chalet have gone out of business. Not only has this reduced competition but it has resulted more than clearance inventory entering the market which has driven up supply. Assuming demand does not weaken, once the excess supply is worked through, Dick’s may see sales begin to pick up. Dick’s omnichannel strategy is also showing some positive signs of e-commerce penetration approaching 20% compared to 6.8% for Target and 1.5% for Wal-Mart.
With regards to Shareholder friendliness, Dick’s has grown its dividend payments on an annualized basis by 5.26% since 2012. Within that period, the frim has also implemented share buyback programs which have reduced the share count by an annualized rate of 2.54%
In summary, Dick’s Sporting Goods Inc. is facing a number of headwinds including rising competitive pressure, changing consumer trends, and the increasing likelihood of a recessionary environment emerging. Based on the conservative assumptions used in the free cash flow analysis, Dick’s may return around 7% at the current market price, but the author advises investors to carefully consider the risks before considering an investment.
To learn more about intrinsic value, check out our comprehensive guide to calculating the intrinsic value of stocks.
Disclaimer: The author does not hold ownership in any of the companies mentioned at the time of writing this article.