Skip to content
 Intrinsic Value Assessment Of Nike (NKE)
By David J. Flood From The Investor’s Podcast Network | 21 October 2017
INTRODUCTION
Nike is an American multinational company engaged in the design, manufacture, marketing, and sale of footwear, apparel, equipment, accessories, and services. Nike is currently a member of the Fortune 500 list with a market cap of $86.6 billion. Its revenues and free cash flows for the previous financial year were around $34.3 billion and $2.5 billion respectively. The company’s common stock has fluctuated between a low of $49 and a high of $60 over the past 52 weeks and currently stands at $53. Is Nike undervalued at the current price?
![]()
THE INTRINSIC VALUE OF NIKE
To determine the intrinsic value of Nike, we’ll begin by looking at the company’s history of free cash flow. A company’s free cash flow is the true earnings which management can either reinvest for growth or distribute back to shareholders in the form of dividends and share buybacks. Below is a chart of Nike’s free cash flow for the past ten years.
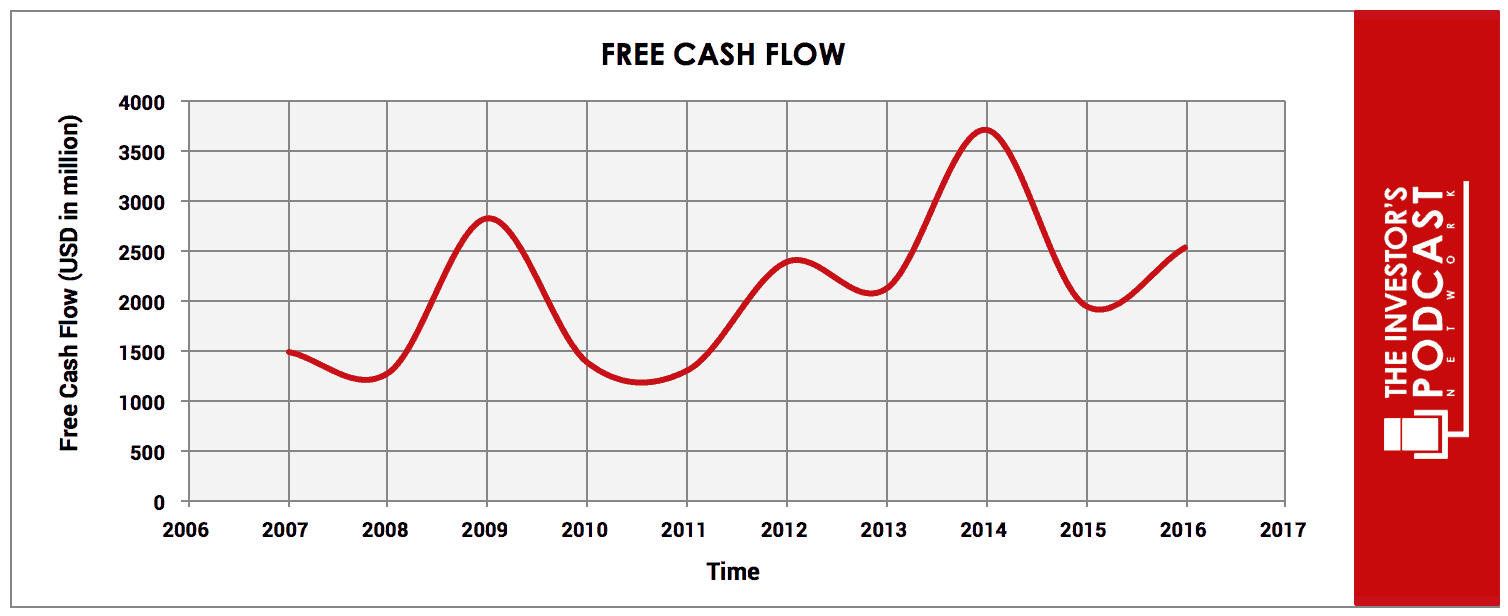
As one can see, the company’s free cash flow has been following an upward trend growing at an annual rate of around 6% for the past ten years. Though, readers will notice that historical free cash flows look a little lumpy from year to year. Nike’s revenues and net income have been consistently growing for the last ten years which suggests that these fluctuations in free cash flow are a result of the company reinvesting earnings to drive growth. To determine Nike’s intrinsic value, an estimate must be made of its potential future free cash flows. To build this estimate, there is an array of potential outcomes for future free cash flows in the graph below.
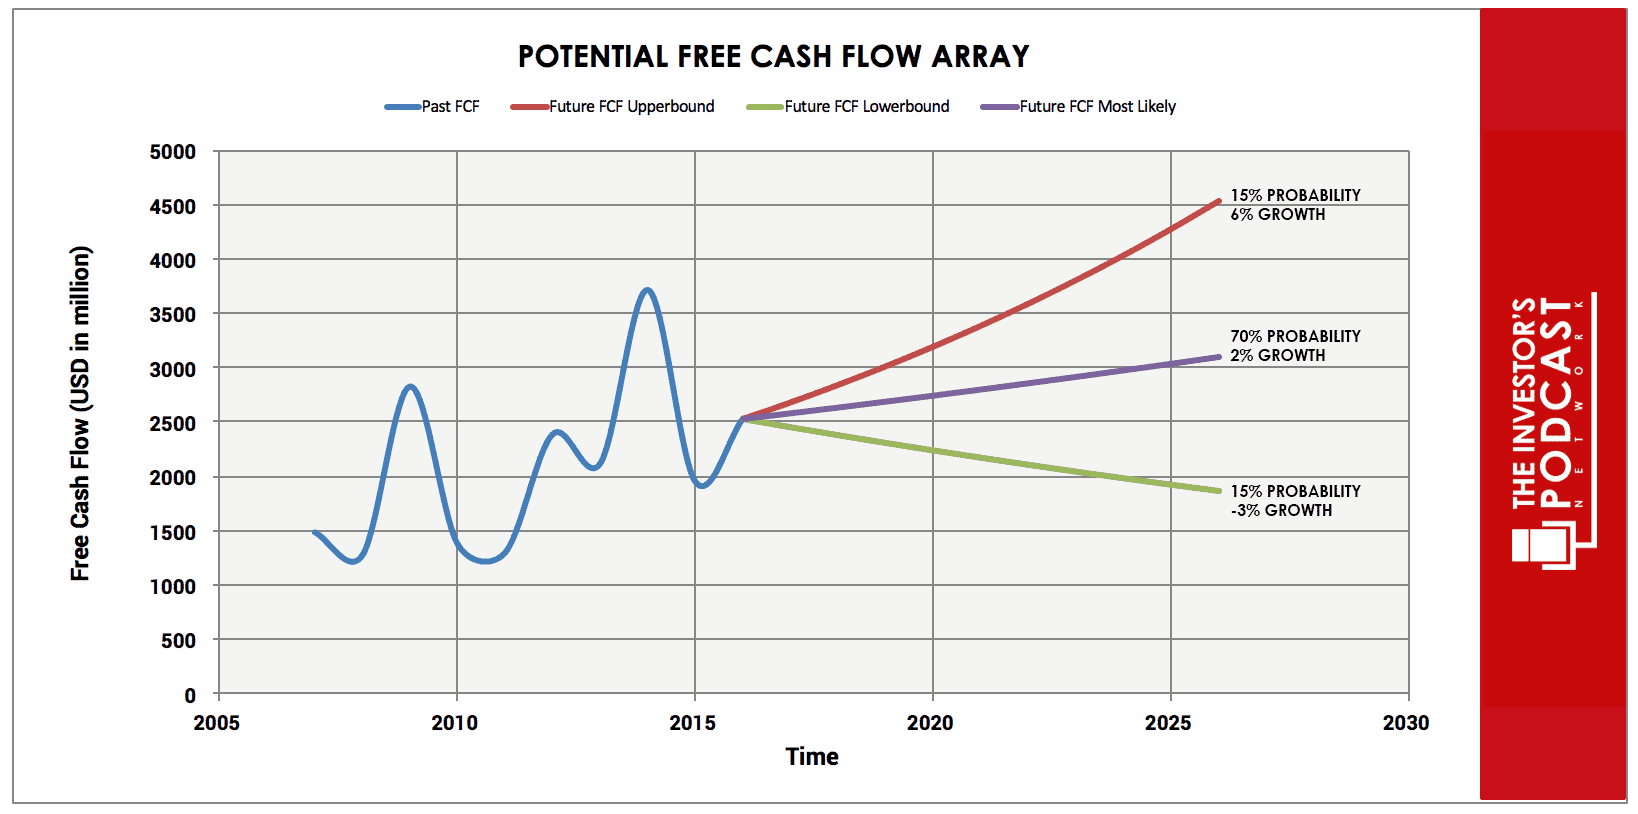
When examining the array of lines moving into the future, each one represents a certain amount of probability. The upper-bound line represents a 6% growth rate. This is based on the company’s 10-year historical free cash flow growth rate and has been assigned a 15% probability of occurrence due factors that will later be addressed.
The middle growth line represents a 2% growth rate and is based on the assumption that future growth will be marginally lower as the company continues to mature. For this reason, it has a 70% probability of occurrence. The lower bound line represents a -3% growth rate in free cash flow growth and has been assigned a 15% probability of occurrence. This lower bound rate assumes that the company’s future free cash flow growth is impacted by competitive pressure and a decrease in growth opportunities. Assuming these potential outcomes and corresponding cash flows are accurately represented, Nike might be priced at a 0.5% to 1% annual return if the company can be purchased at today’s price. We’ll now look at another valuation metric to see if it corresponds with this very low return.
Based on Nike’s current earnings yield, which is the inverse of its EV/EBIT ratio, the company is projected to return around 5%. While this is roughly in line with the upper-bound line in our free cash flow array, it is below the company’s historical median earnings yield of 6.70%, suggesting that Nike is currently overvalued. Looking at the company’s PEG ratio, a metric favored by Peter Lynch, Nike’s current PEG ratio is 1.82. This is above a fair value figure of 1, suggesting that the company is indeed overvalued. Taking all these points into consideration, it seems reasonable to assume that Nike is overvalued relative to the S&P 500 and the market’s historical valuation for the company. Furthermore, the company may only return around 1% at the current price if the estimated free cash flows are achieved. Now, let’s discuss how and why these estimated free cash flows could be achieved.

THE COMPETITIVE ADVANTAGE OF NIKE
Nike has various competitive advantages outlined below:
- Branding. Nike’s most valuable asset is undoubtedly its brand. According to the latest report from Brand Finance, a leading valuation and strategy consultancy firm, the current value of Nike’s brand is estimated to be approximately $32 Billion. The company aggressively protects its brand and has registered multiple trademarks in over 170 jurisdictions. It also holds a portfolio of copyrights and patents which protect its proprietary components, technologies, manufacturing techniques, features and industrial design. Warren Buffett is a huge fan of companies which possess a competitive advantage stemming from intangible assets such as brands as they are the most difficult for a competitor to replicate.
- Bargaining power. Since Nike contracts the manufacture of its products to low wage countries within Asia, it can easily switch between suppliers. This grants the company huge bargaining power. This is evident in the fact that, in the last ten years, the firm’s average gross margin has been 45%.
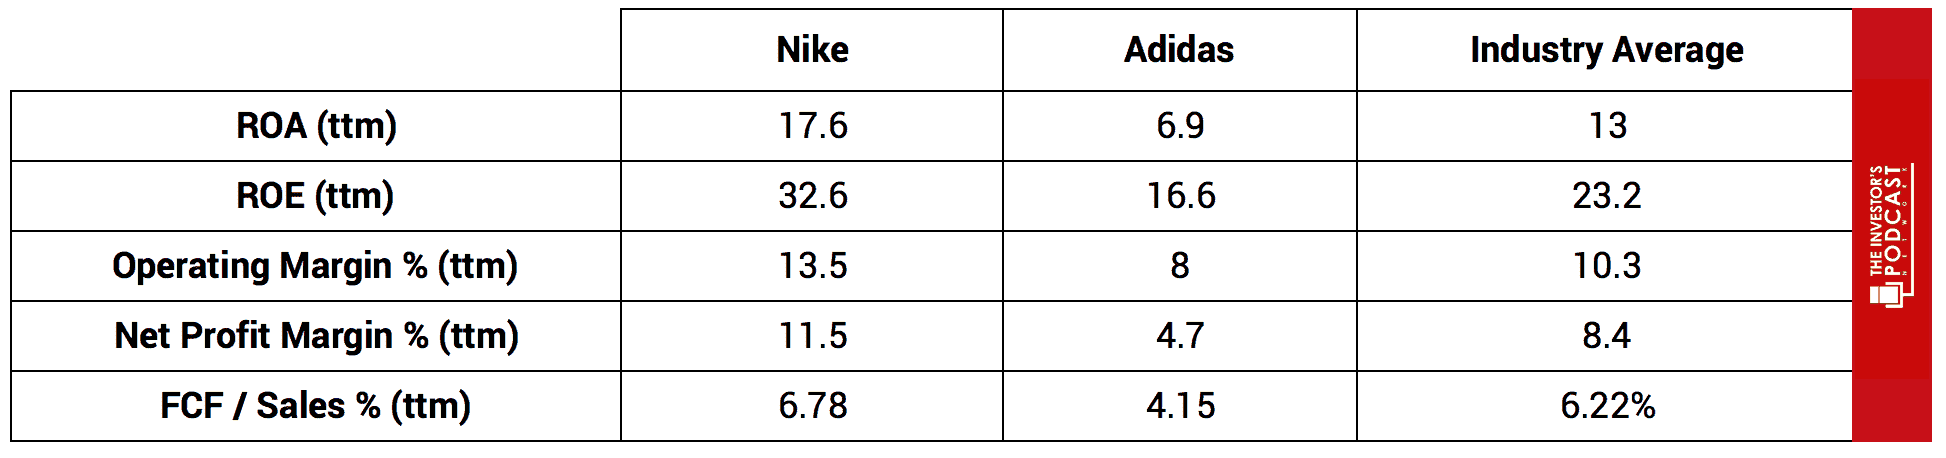
- Pricing power. While alternative products are available from competing firms, Nike can charge a premium for its products due to its powerful brand and celebrity/sports star endorsements which create a relationship of loyalty between the company and its customers. This is demonstrated by the fact that Nike significantly outperforms its closest rival Adidas and the footwear/sports clothing industry at large. The chart below details this outperformance based on a comparison of several common performance metrics.
NIKE’S RISKS
Now that Nike’s competitive advantages have been considered let’s look at some of the risk factors that could impair my assumptions of investment return.
- While Nike does possess multiple competitive advantages, there is still a possibility that one of its rivals could mount a challenge to erode its competitive advantages and move on its market share. Under Armour has been a fierce competitor and continues to take more market share from Nike. This is especially true with younger generations and areas where future growth is important.
- The emergence of a serious economic crisis similar to that witnessed in 2008 could materially impact the company’s revenues and profits leading to lower growth in the coming years. Nike’s historical performance suggests that it can weather these types of storms comfortably, but this risk is still worthy of considerations by investors.
- A failure to continue to secure high-quality endorsements from athletes, sports stars and celebrities could weaken the perception of prestige and quality associated with Nike’s products. This, in turn, would weaken brand loyalty and the firm’s pricing power which may impact revenues and earnings.
- A failure to maintain Nike’s reputation and brand image could materially impact the firm’s economic performance in the future. The emergence of scandals or bad publicity associated with the company’s brand or products would certainly be detrimental. In addition, any adverse publicity related to legal or regulatory action could tarnish the image of the company, leading to a weakening of the firm’s brand and prospects of growth.
OPPORTUNITY COSTS
Whenever an investment is considered, one must compare it to any alternatives to weigh up the opportunity cost. At present, 10-year treasuries are yielding 2.16%, if we take inflation into account, the real return is likely to be closer to 1%. The S&P 500 Index is currently trading at a Shiller P/E of x 30, meaning it is priced for an earnings yield of 3.3%. Nike, therefore, appears to offer a lower rate of return for investors with a higher amount of risk, and therefore should be avoided.
MACRO FACTORS
Investors must consider macroeconomic factors that may impact economic and market performance as this could influence investment returns. At present, the S&P is priced at a Shiller P/E of 30. This is over 85% higher than the historical average of 16.8, suggesting markets are at elevated levels. U.S. unemployment figures are at a 30-year low suggesting that the current business cycle is nearing its peak. U.S. private debt/GDP currently stands at 199.6% and is at its highest point since 2009 when the last financial crisis prompted private sector deleveraging.
SUMMARY
The future for Nike looks favorable if it can maintain its dominant position within the footwear and sports clothing market. Although the company may continue to perform well, owning new equity in the company at such high prices is likely to produce unfavorable results when compared to other options in the market. Management is targeting a $50 billion revenue goal by 2020 which may be overly ambitious but certainly not impossible. If the firm can continue its aggressive expansion into the Chinese market, where it has already achieved a revenue growth rate of 24% over the past two years, it may well achieve this target. While the company may not be a sound investment currently due to a high price, it has great management, a superior brand, and excellent operations. It’s worth watching in the future to see if the market offers a better opportunity at a more appropriate price.
To learn more about intrinsic value, check out our comprehensive guide to calculating the intrinsic value of stocks.