Intrinsic Value Assessment Of General Mills, Inc. (GIS)
By Stephen Barnes From The Investor’s Podcast Network | 09 September 2018
INTRODUCTION
General Mills, Inc. is a leading manufacturer and marketer of branded consumer foods sold through retail stores. It is also a leading supplier of branded and unbranded food products to the foodservice and commercial baking industries in North America. Following its recent $8 billion purchase of Blue Buffalo Pet Products, Inc. (Blue Buffalo), General Mills, Inc. is now a leading manufacturer and marketer in the wholesome natural pet food category.
According to the company’s most recent Form 10-K, General Mills, Inc. focuses on six large global categories:
- Snacks (Including grain, fruit, savory snacks, nutrition bars, and frozen hot snacks)
- Ready-to-Eat Cereal
- Yogurt
- Convenient meals (Including meal kits, ethnic meals, pizza, soup, side dish mixes, frozen breakfast, and frozen entrees)
- Pet food
- Super-Premium Ice Cream
Other less significant product categories include:
- Baking Mixes and Ingredients
- Refrigerated and Frozen Dough
General Mills, Inc.’s primary customers include grocery stores, membership stores, natural food chains, drug stores, dollar and discount chains, e-commerce retailers, commercial and non-commercial foodservice distributors, operators, restaurants, convenience stores, and pet specialty stores.
The company’s products are marketed under numerous valuable trademarks. Some of the more important trademarks include: Annie’s, Betty Crocker, Bisquick, Blue Buffalo, Bugles, Cascadian Farm, Cheerios, Chex, Cinnamon Toast Crunch, Cocoa Puffs, Cookie Crisp, EPIC, Fiber One, Food Should Taste Good, Fruit by the Foot, Fruit Gushers, Fruit Roll-Ups, Gardetto’s, Go-Gurt, Gold Medal, Golden Grahams, Häagen-Dazs, Helpers, Jeno’s, Jus-Rol, Kitano, Kix, La Salteña, Lärabar, Latina, Liberté, Lucky Charms, Muir Glen, Nature Valley, Oatmeal Crisp, Old El Paso, Pillsbury, Progresso, Raisin Nut Bran, Total, Totino’s, Trix, Wanchai Ferry, Wheaties, Yoki, and Yoplait.
The Company’s current market cap is about $26.2 Billion, and its enterprise value (i.e., market cap + total debt net of cash) is approximately $41.6 Billion. During the previous fiscal year, it generated $15.7 Billion in sales and $2.2 Billion in free cash flow (after interest expense). The company’s common stock has fluctuated between a high of $60.69 and a low of $41.01 over the past 52 weeks and currently stands at around $45.87. Is General Mills undervalued at the current price?
THE INTRINSIC VALUE OF GENERAL MILLS, INC.
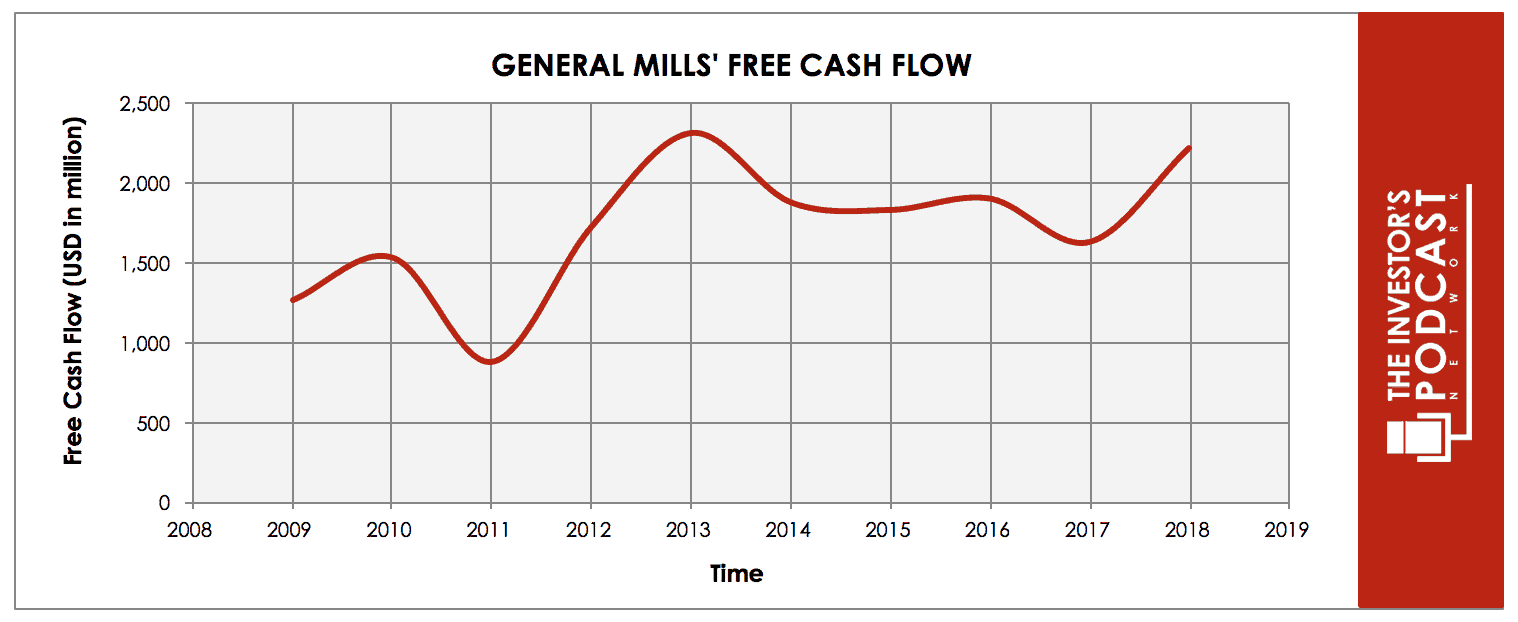
To determine the intrinsic value of General Mills Inc., we’ll start by looking at the company’s historical free cash flow. A company’s free cash flow is the true earnings which management can either reinvest for growth or distribute back to shareholders in the form of dividends and share buybacks. Below is a chart of General Mills, Inc.’s free cash flow for the past ten years.
As one can see from the chart above, the company’s free cash flow has grown over the last ten years from $1.27 billion in the fiscal year 2009 to $2.22 billion in the fiscal year 2018. In other words, free cash flow grew at a compound annual growth rate (CAGR) of 5.74% over the past ten years.
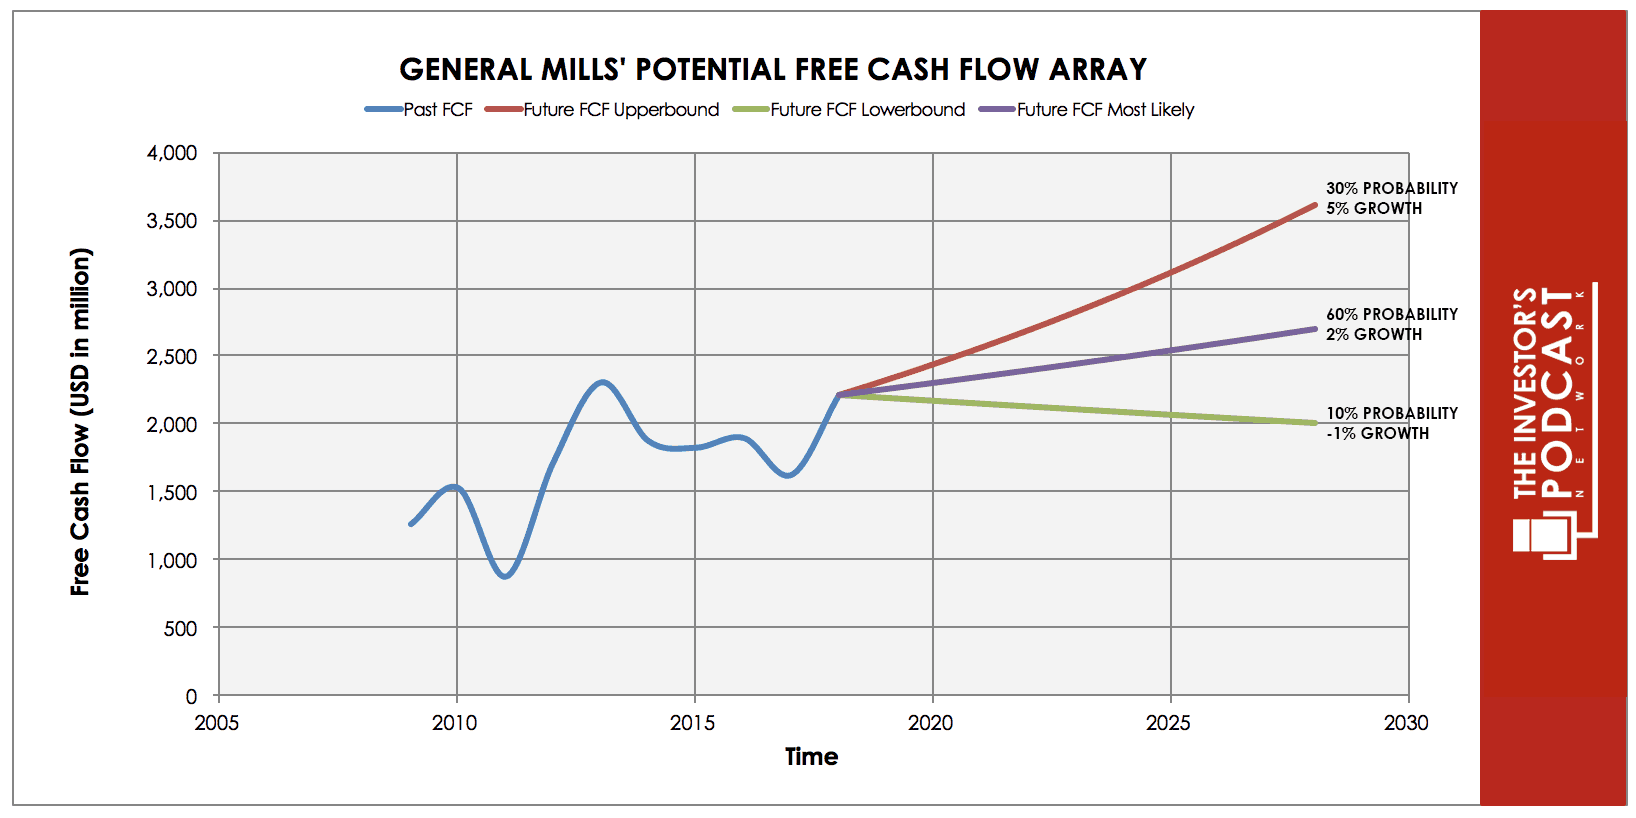
To determine General Mills, Inc.’s intrinsic value, an estimate must be made of its potential future free cash flows. To help us build this estimate, below we have calculated and displayed an array of potential outcomes for future free cash flows.
When examining the array of lines moving into the future, each one represents a certain probability of occurrence. The upper-bound line represents a 5% growth rate which is less than the 5.74% compounded annual growth rate (CAGR) achieved over the past ten years as mature companies can seldom maintain growth rates above historical growth rates for prolonged periods. This 5% growth rate has been assigned a 30% probability of occurrence to account for a number of factors including fierce competition and promotional activity among branded food manufacturers and private-label products as retailers consolidate, offset somewhat by potential revenue and earnings increases from future acquisitions.
The middle growth line represents a 2% growth rate. This is slightly below the current rate of a 10-Year Treasury Note, which is a good proxy for projected GDP growth (i.e., the growth of the overall economy) over the next ten years. General Mills, Inc. is likely to grow at least as fast as the overall economy—especially when considering that demand for consumer food products is expected to grow over time merely from global population growth alone. This scenario has been assigned a 60% probability of occurrence, as it is most likely to occur.
The lower bound line represents a negative 1% growth rate in free cash flow and assumes that the company will shrink slowly over time. This scenario has been assigned a 10% probability, as it is not likely, but certainly possible if retail consolidation, and hence pressure for lower prices continue to occur. This will be the case if General Mills, Inc. is unable to accurately anticipate and position its portfolio of products and brands to capitalize on changing consumer trends (such as the movement toward more healthy, organic, and sustainable food offerings).
Assuming these potential outcomes and corresponding cash flows are accurately represented, General Mills, Inc. might be priced to generate an 8.8% annual return if the company can be purchased at today’s price of $45.75. Let’s now take a look at another valuation metric to see if it corresponds with this estimate.
Based on General Mills, Inc.’s current earnings yield, which is the inverse of its EV/EBIT ratio, the company is currently yielding 7.1%. This is above the Consumer Staples Sector median average of 5.8% suggesting that the company may be undervalued on a comparable basis. Analysts project that General Mills, Inc. will have an earnings yield based on next year’s earnings (a forward EBIT yield) of 7.4% compared to 6.2% for the Consumer Staples Sector. Finally, we’ll look at General Mills, Inc.’s free cash flow yield—a metric which assumes zero growth and simply measures the firm’s trailing free cash against its current market price. At the current market price, General Mills, Inc. has a free cash flow yield of 8.3% compared to 3.8% for the Consumer Staples Sector.
Taking all these points into consideration, it seems reasonable to assume that General Mills, Inc. is currently trading at a discount to fair value. Furthermore, the company may return around 8.8% annually at the current price if the estimated free cash flows are achieved. Now, let’s discuss how and why these estimated free cash flows could be achieved.
THE COMPETITIVE ADVANTAGE OF GENERAL MILLS, INC.
General Mills has various competitive advantages outlined below.
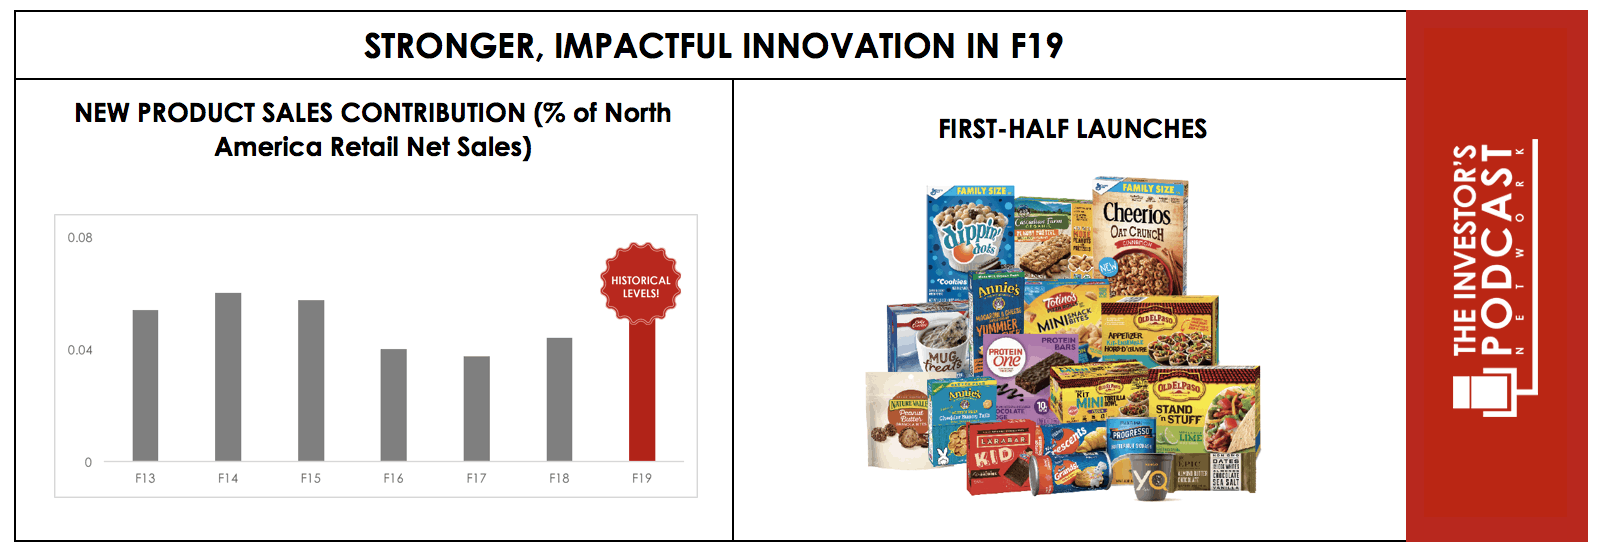
- Brand Value. One of General Mills’ most powerful competitive advantages is its portfolio of recognizable brands. General Mills, Inc. owns and sells its products under numerous leading and trusted brands in multiple categories (see the list of brands in the company profile section above). General Mills can leverage these brands to launch new products under familiar names.
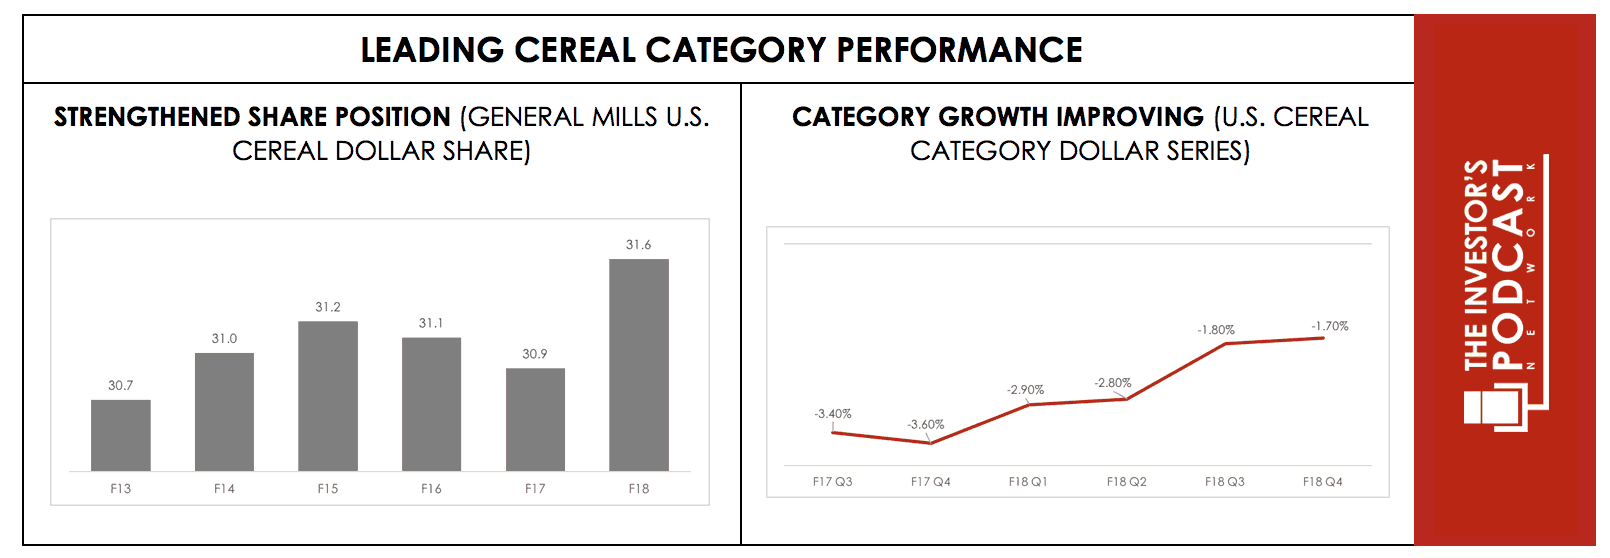
In the cereal category, General Mills, Inc. owns three of the top five brands in the U.S. and has 30% plus domestic market share.
In the yogurt category, the Yoplait and Go-Gurt brands have enabled the company to take 18% domestic market share. And finally, popular brands like Betty Crocker, Bisquick, Gold Medal, Pillsbury, Annie’s, Nature Valley, and others have allowed General Mills, Inc. to bolster 50% and 40% domestic market share in the baking mixes and gran snacks categories, respectively.
For a competitor to challenge General Mills’ competitive brand position, they would have to deploy a large amount of capital and resources on advertising, sponsorships, and distribution. In fact, over the past decade, General Mills, Inc. has spent about $800 million per year (or approximately 5% of sales) on advertising and media to support and grow its brands.
General Mills, Inc.’s various brands help to differentiate the company’s products and likely grant it some pricing power with consumers. This pricing power is one factor that allows the company to outperform the industry on a number of key metrics.
- Cost Advantages and Economies of Scale. General Mills, Inc. benefits from cost advantages stemming from its large and expansive operations. The company’s extensive manufacturing and distribution network allows it to produce and distribute products at a lower per unit cost than most competitors. And, to some degree, the company’s scale gives it some negotiating leverage with distributors and retailers and allows it to spread advertising and research and development costs over a larger revenue base, resulting in higher operating margins than its smaller competitors.
These scale advantages are anticipated to enable General Mills, Inc. to leverage its purchase of Blue Buffalo, which is a premier natural pet food supplier with a strong brand and over 30% market share in the fast-growing natural pet food segment of the U.S. market. Pets are increasingly seen as a member of the family, and this humanization trend has led pet owners to seek premium foods for their dogs and cats. General Mills, Inc. will likely be able to leverage its retail relationships and distribution network to reduce Blue Buffalo’s per unit costs and thereby improve margins. As is likely to be the case with Blue Buffalo, the company’s scale and distribution advantage may allow it to deliver high returns on acquisitions for many years in the future.
GENERAL MILLS, INC.’S RISKS
Now that General Mills, Inc.’s competitive advantages have been considered, let’s look at some of the risk factors that could impair our assumptions of investment return.
- Changing Consumer Preferences. General Mills, Inc.’s success depends in large part on its ability to anticipate the tastes, preferences, and eating habits of consumers. Many consumers—especially Millennials—are increasingly looking to purchase healthier and fresher food options and niche brands. This puts pressure on General Mills to develop products and brands that resonate with these consumers. If General Mills, Inc. fails to adequately anticipate, identify, and react to these changes and trends, its market share, sales, and profitability are likely to decline. In fact, the company has already experienced sales declines in two key categories—cereal (17% of sales) and yogurt (15% of sales)—over the past five years. The company’s success going forward largely hinges on its ability to stabilize market share in these two categories.
- Consolidating Retail Environment. The grocery industry has experienced significant consolidation as of late, resulting in an increased concentration of purchasing power. For instance, in fiscal 2018, Walmart accounted for 21% of General Mills, Inc.’s consolidated net sales and 30% of General Mills’ North America Retail segment. Large grocery retailers like Walmart could use their increased size and newfound negotiating leverage to seek lower pricing and squeeze margins from food manufacturers and suppliers like General Mills, Inc. They could also use their increased size and scale to aggressively market their private label branded products over General Mills’ branded products. This is also true for General Mills, Inc.’s newly formed pet segment following the purchase of Blue Buffalo. At the end of 2017, PetSmart (including Chew.com) and Petco accounted for 41% and 18%, respectively, of Blue Buffalo’s net sales.
- Lower Sales and Margins in Economic Downturn. Finally, even though consumers may not be as price-sensitive to low-cost food items as other types of products, consumers may switch away from General Mills, Inc.’s branded products to cheaper generic or private label products when the economy is doing poorly. In such a situation, General Mills, Inc. could experience lower overall sales and a simultaneous shift toward lower margin products.
OPPORTUNITY COSTS
Whenever an investment is considered, one must compare it to any alternatives to weigh up the opportunity cost. At the time of writing, 10-year treasuries are yielding 2.98%. If we take inflation into account, the real return is likely to be closer to 1%. The S&P 500 Index is currently trading at a Shiller P/E of 32.1 which is 89.9% higher than the historical mean of 16.8. Assuming reversion to the mean occurs, the implied future annual return is likely to be -2.8%. General Mills, Inc., therefore, appears to offer a much better return for investors at present, but other individual stocks may be found which offer a similar return relative to the risk profile.
MACRO FACTORS
Investors must consider macroeconomic factors that may impact economic and market performance as this could influence investment returns. At the time of writing, the S&P is priced at a Shiller P/E of 32.1; This is 89.9% higher than the historical average of 16.8 suggesting markets are at elevated levels. U.S. unemployment figures are at a 30-year low suggesting that the current business cycle is nearing its peak. U.S. private debt/GDP currently stands at 199.6% and is at its highest point since 2009 when the last financial crisis prompted private sector deleveraging.
SUMMARY
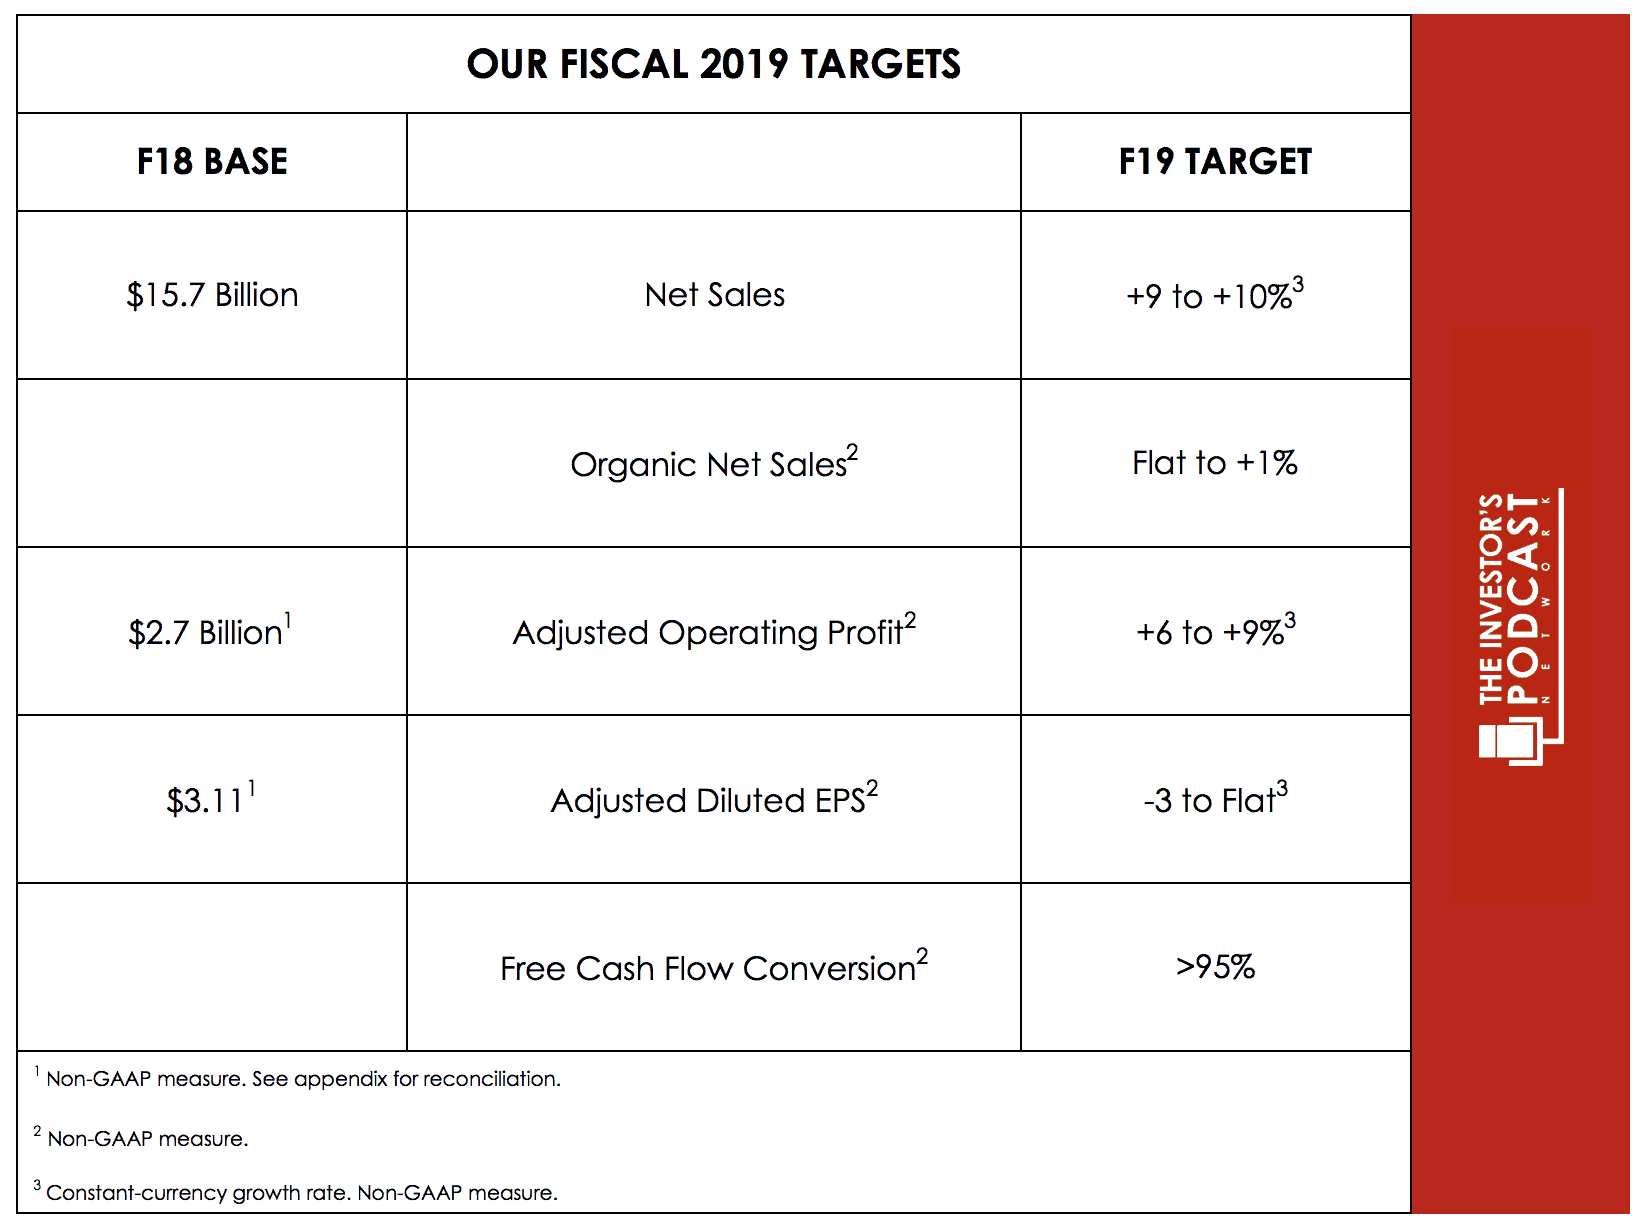
General Mills, Inc. is competitively positioned given advantages that are difficult for competitors to replicate: (1) A stellar portfolio of well-known and trusted brands and (2) cost advantages driven by economies of scale. For fiscal 2019, the company is targeting 9 to 10% sales growth (from a 2018 base of $15.7 billion) and 6 to 9% adjusted operating profit growth (from a 2018 base $2.7 billion). Furthermore, the company should remain a steady generator of free cash.
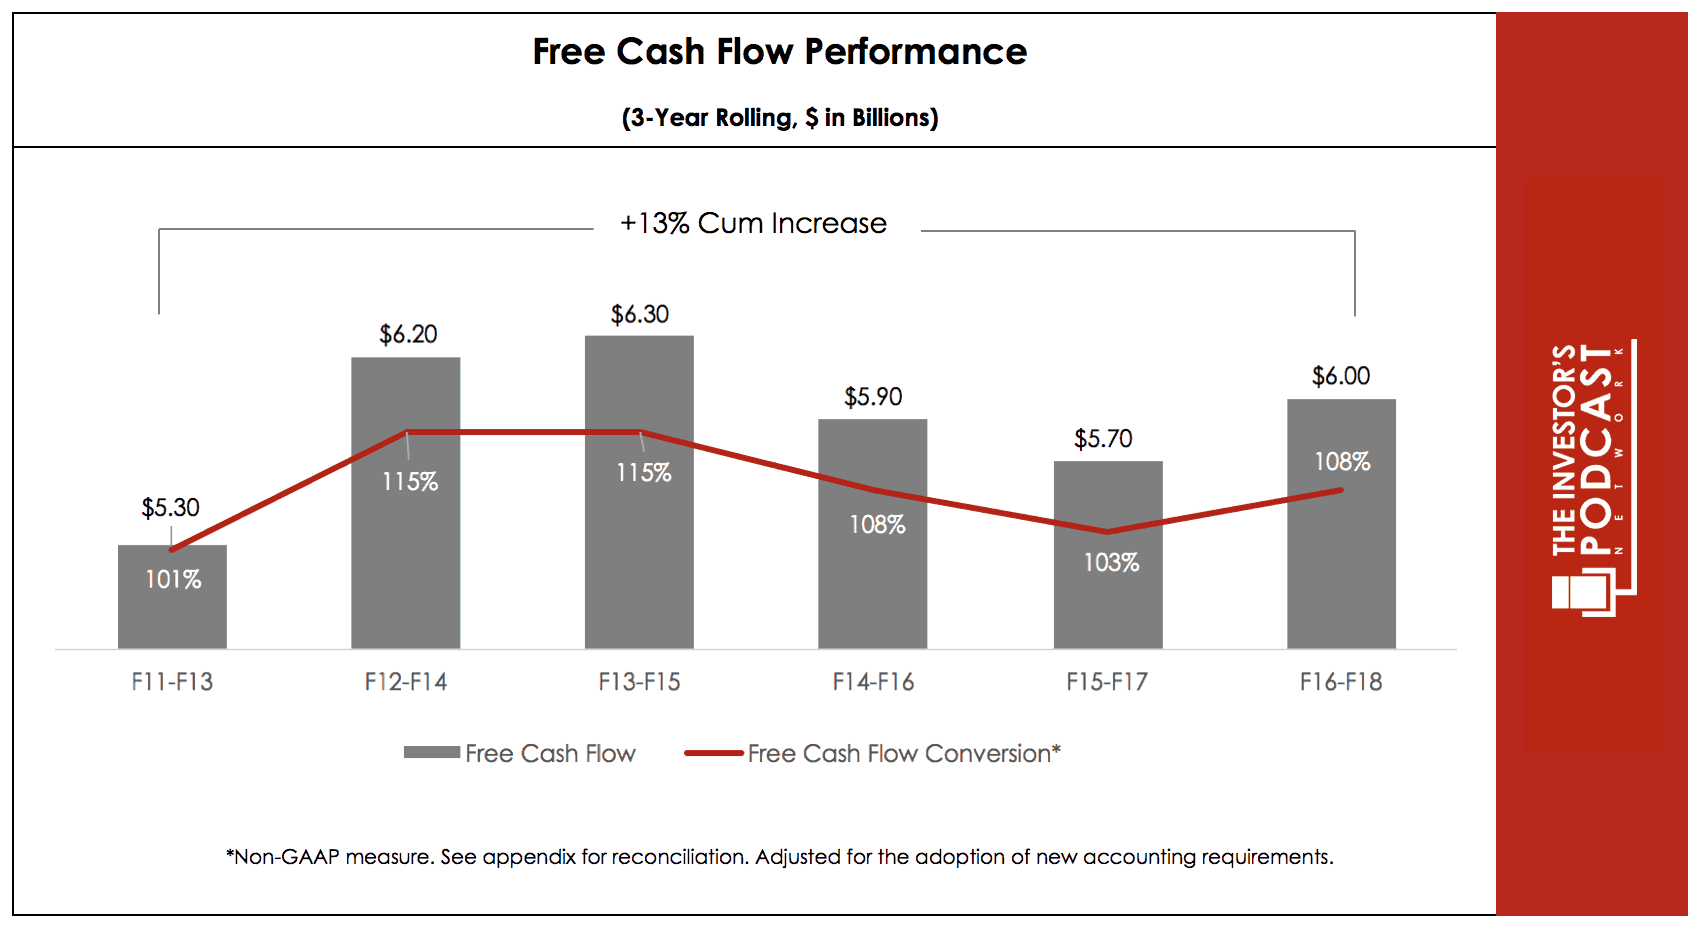
As you can see from the slide below, the company has generated around $6 billion in free cash flow over the past five three-year rolling periods.
Despite the foregoing advantages, one should acknowledge that General Mills, Inc.’s business has come under pressure as of late with recent changes in consumer preferences that seem to have caught the company off-guard and the consolidating retail environment that has given some retailers more bargaining power on wholesale prices and resources to promote their own private-label products.
That being said, shares of General Mills, Inc. currently look attractive as the market tends to be overly myopic and weighing the company’s near-term issues—such as market share declines in a few key categories—much more than the company’s wide moat and long-term prospects.
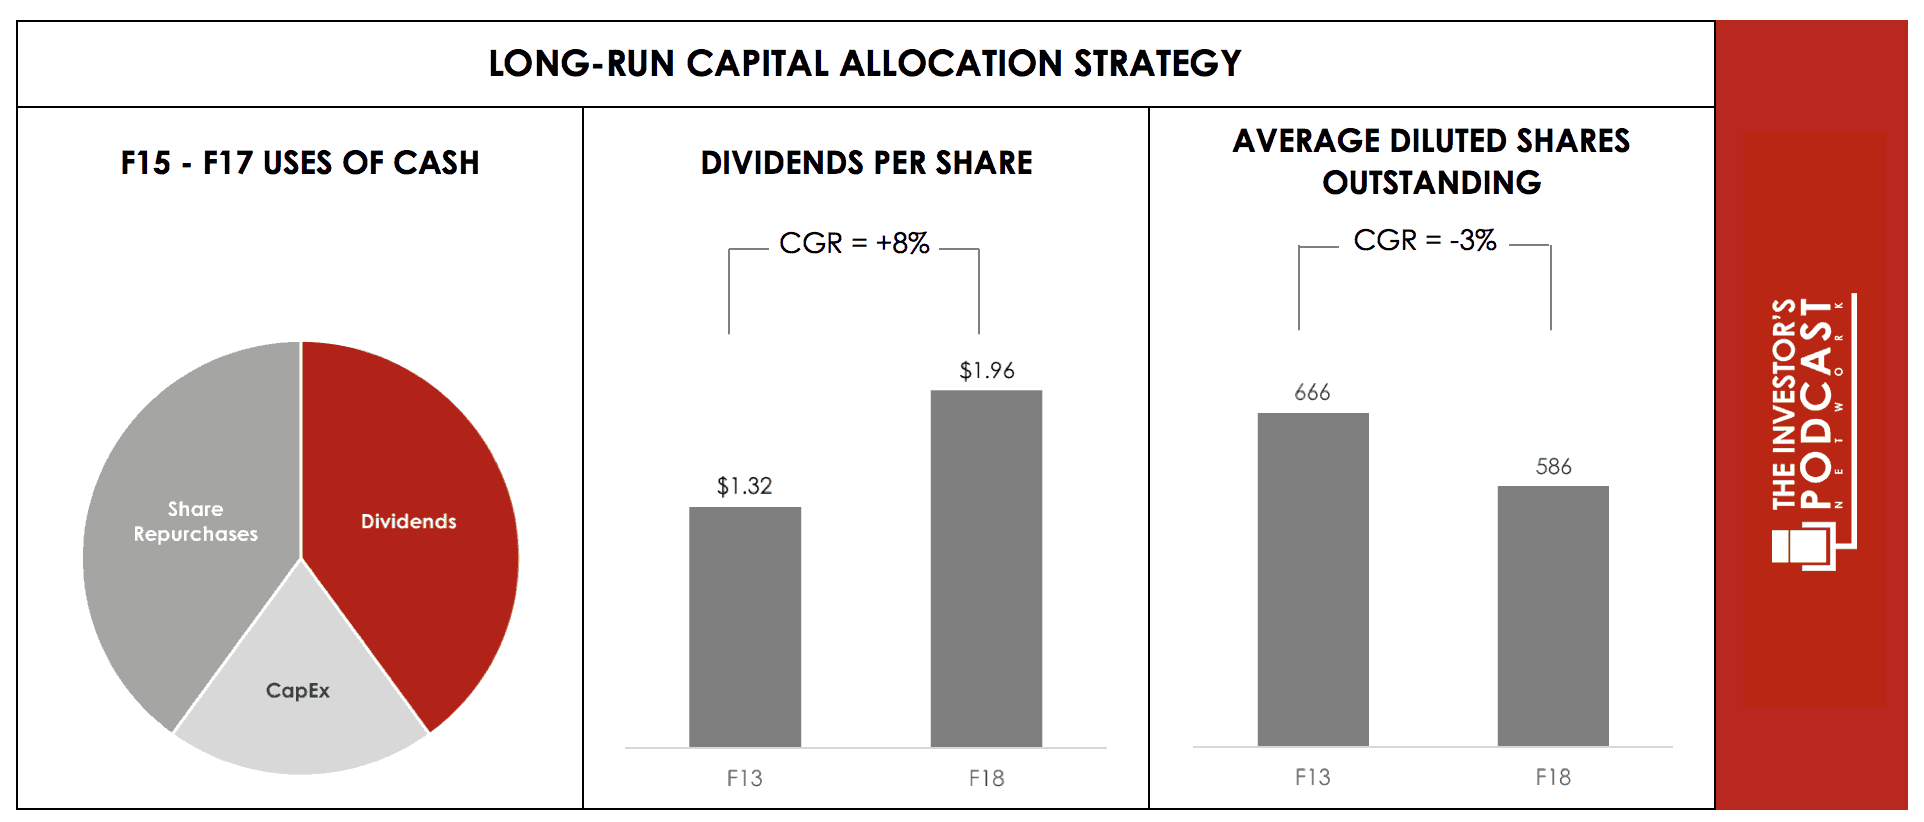
Moreover, General Mills, Inc.’s management has been quite friendly to shareholders by consistently returning cash to shareholders in the form of dividends and share repurchases. In fact, from fiscal 2013 to fiscal 2018, General Mills, Inc. increased dividends per share by more than 8% per year and reduced diluted shares outstanding by approximately 3% per year.
In summary, General Mills, Inc. is a dominant player in the fairly stable consumer staples sector. Its shares are selling at a reasonable price based on the amount of cash it is anticipated to generate into the foreseeable future. Indeed, based on the assumptions used in the analysis above, General Mills, Inc. may return around 8.8% to shareholders annually if purchased at the current market price of $47.75. Assuming that diversified market investors generally require a 7% annual rate return (equating roughly to a 14x earnings multiple), then it stands to reason that General Mills, Inc. is trading at about a 25% discount ([8.8% – 7%]/7% = 0.2571) at current prices.
To learn more about intrinsic value, check out our comprehensive guide to calculating the intrinsic value of stocks.
Disclosure: The author of this article is long GIS at the time of writing this article.


